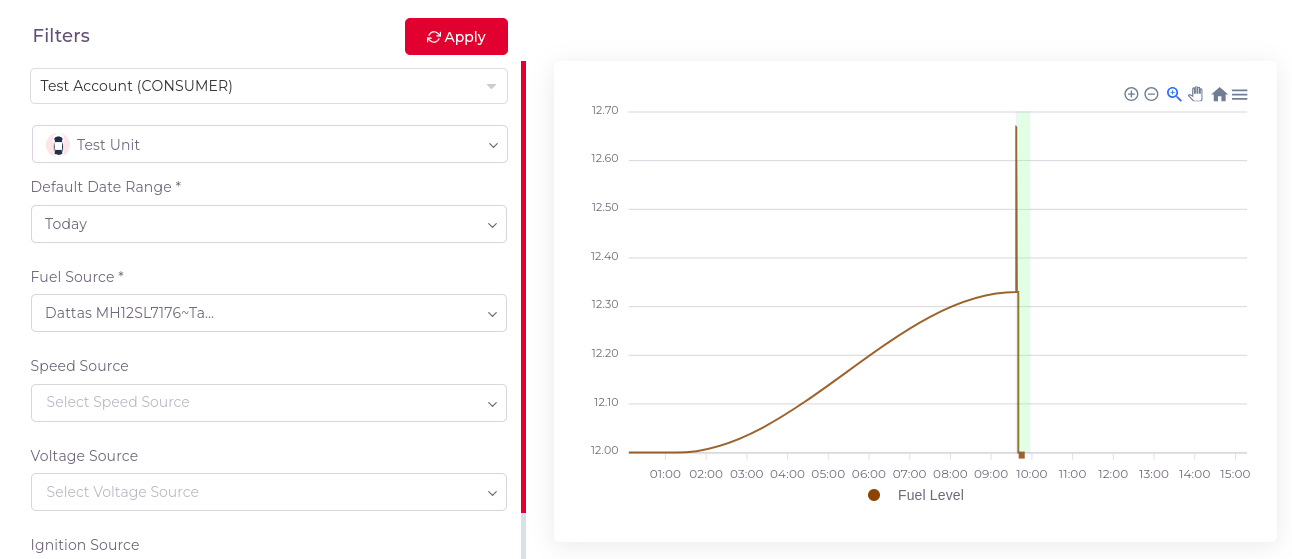
¶ Key Features
-
Unit-Wise Fuel Consumption:
- Displays fuel consumption data for each unit, allowing users to monitor fuel usage across the fleet.
-
Date-Based Filtering:
- Users can filter fuel consumption data by specific dates to get a detailed view of fuel usage during particular time periods.
- In fuel consumption allowed only single units and in units fuel sensors is manadatory for this chart
¶ How to Use the Fuel Consumption Page
-
Navigate to Fuel Consumption:
- Click on the Widgets and select Fuel Consumption.
-
View Unit-Specific Fuel Data:
- The page displays fuel consumption for each unit in the fleet, organized by date.
-
Filter by Date:
- Users can apply filters to check the fuel consumption of units for specific dates or date ranges.
-
Select Data Sources:
- For each unit, you can select specific sensors from dropdowns to customize the chart data:
- Fuel Source: A dropdown list contains available fuel sensors in the selected unit. Choose a sensor to display the fuel data for that unit.
- Speed Source: A dropdown list contains available speed sensors for the selected unit. Pick a speed sensor to correlate fuel consumption with speed.
- Voltage Source: A dropdown list displays available voltage sensors in the unit. Select a voltage sensor to track battery or power supply performance.
- Ignition Source: A dropdown list shows ignition sensors available in the selected unit. Choose a sensor to monitor ignition status (on/off) during fuel consumption.
- Understand the Chart:
- The Y-axis represents the fuel level, and the X-axis represents the date. This allows users to track fuel consumption trends over time.
- The chart provides insights into daily fuel consumption patterns and their correlation with speed, voltage, and ignition activity.