¶ Key Features
-
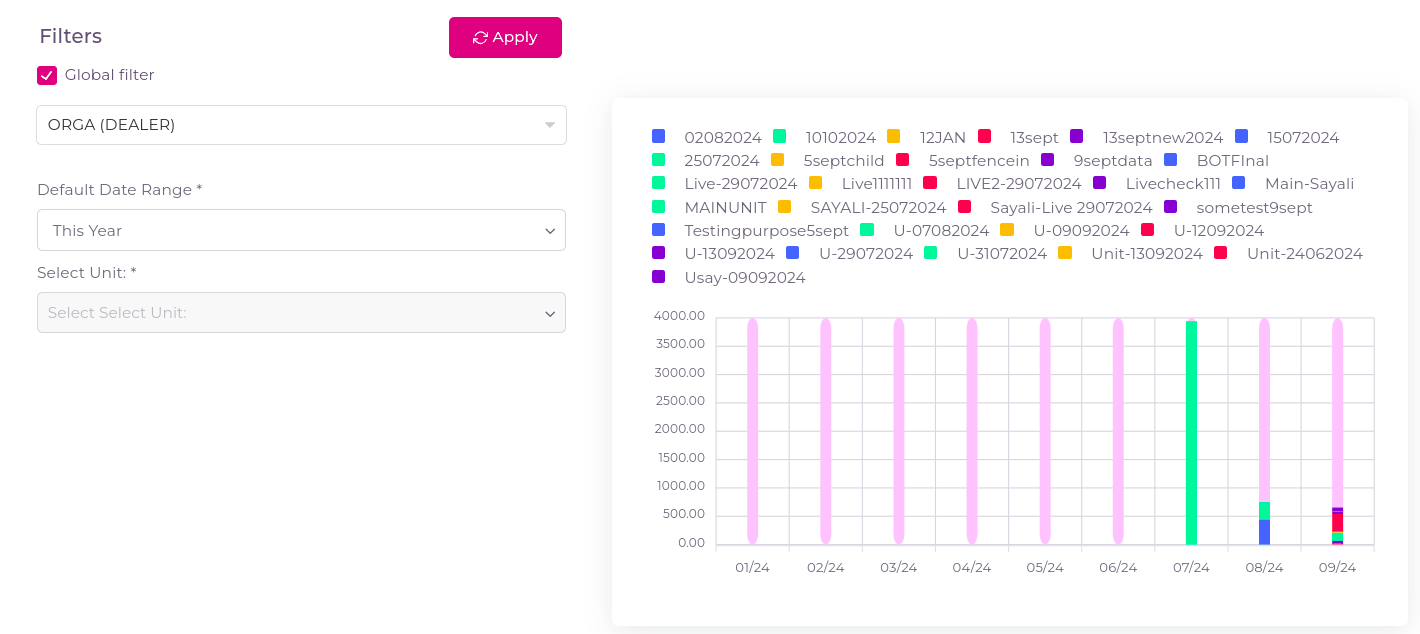
Unit Running Chart:
- Displays unit-wise running times in a visual format, allowing fleet managers to assess vehicle performance and utilization.
-
Date Filters:
- Users can apply date filters to narrow down the data for specific periods, helping track the running hours of each vehicle.
-
Unit Filters:
- Apply unit filters to analyze unit statuses over specific units.
- If you checked the global filter then whatever units and groups are selected in the Filters tab that will be applicable.
¶ How to Use the Unit Running Page
-
Navigate to Unit Running:
- Click on the Widgets and select Unit Running.
-
Apply Date Filters:
- Use the date filter to specify the period for which you want to view running time data.
-
Analyze Running Time:
- The page presents a chart displaying the running time for each unit, offering insights into vehicle efficiency and performance over the selected timeframe.
-
Understand the Chart:
- The chart uses Y-coordinate to indicate the distance covered in kilometers and the X-coordinate to represent the date, allowing users to track daily running performance over time.