¶ Overview
The Using Calculation Table feature allows users to configure and apply tables to sensor data in devices. This powerful tool is designed for users to perform complex data operations, visualize sensor data, and ensure accurate sensor readings.
¶ Navigating to the Calculation Table
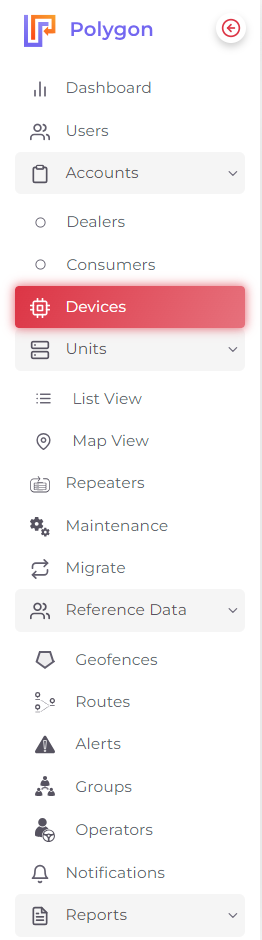
- Go to the left side menu and select Devices.
- Add or edit a device.

- Navigate to Sensors.
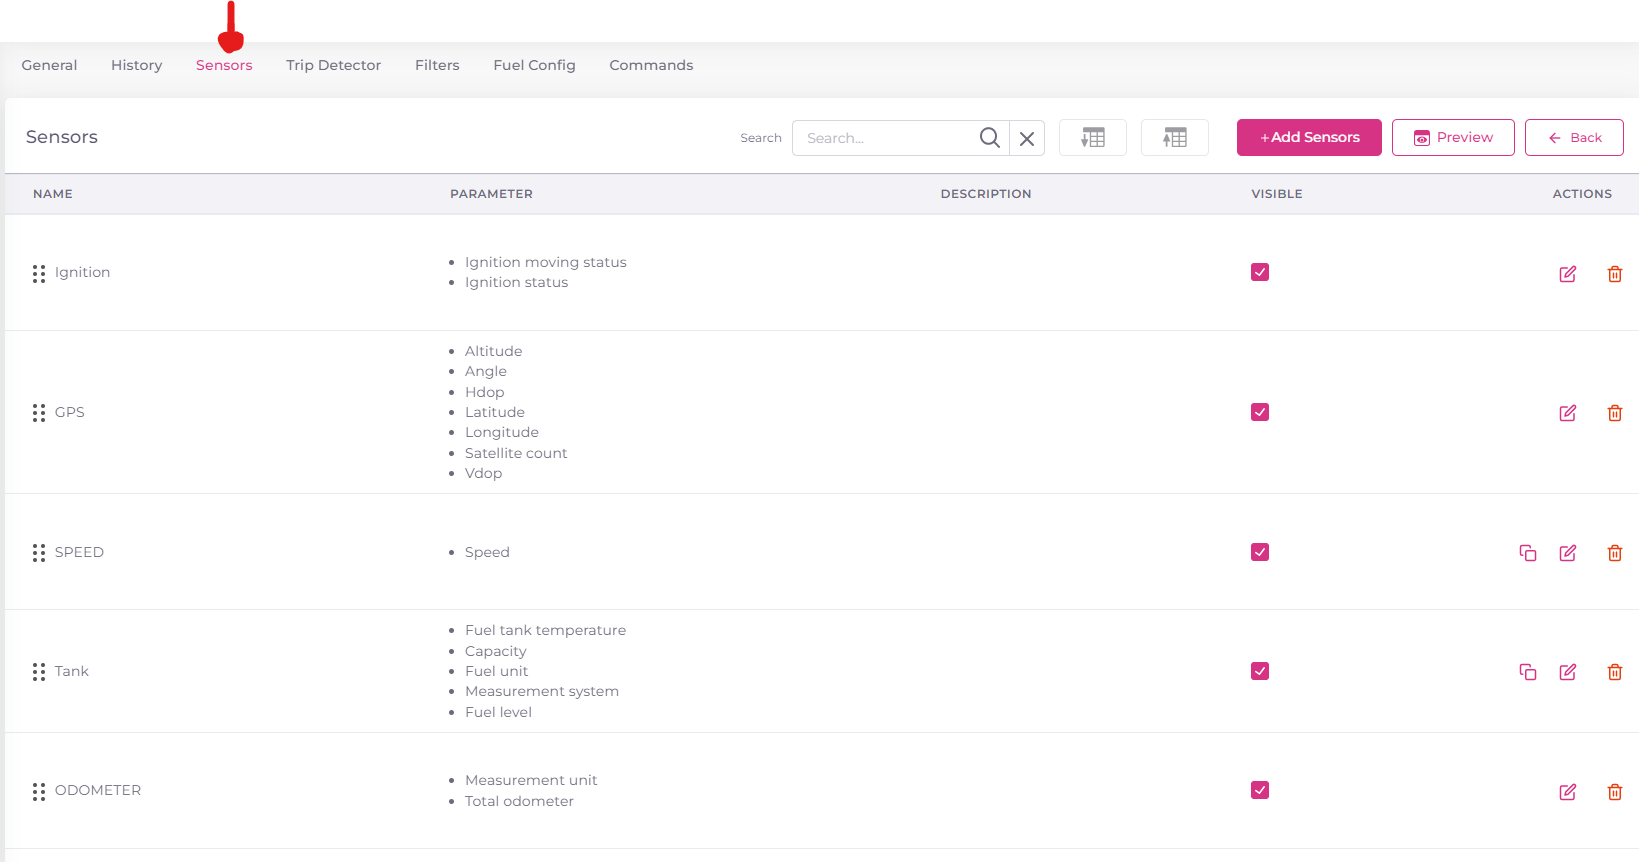
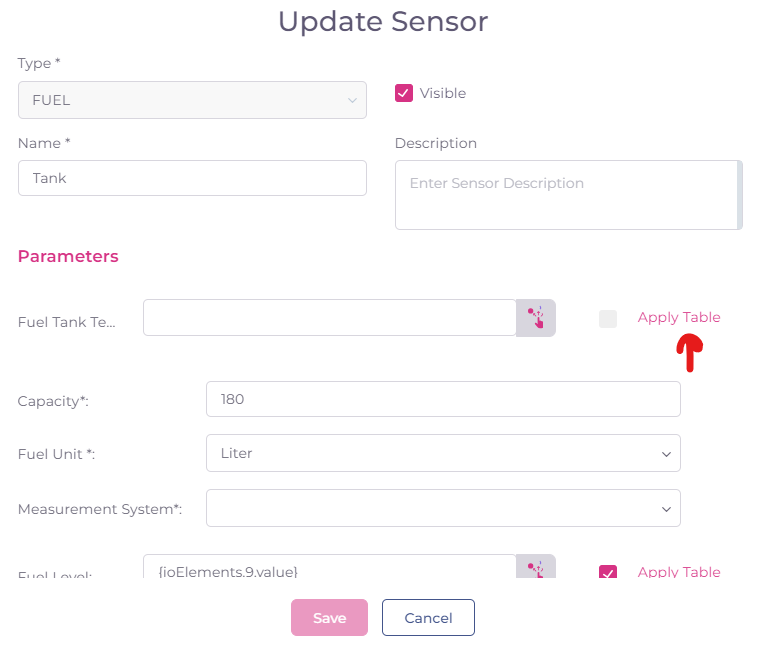
- Click Add or Edit on the desired sensor.

- Click on Apply Table.
¶ The Interface
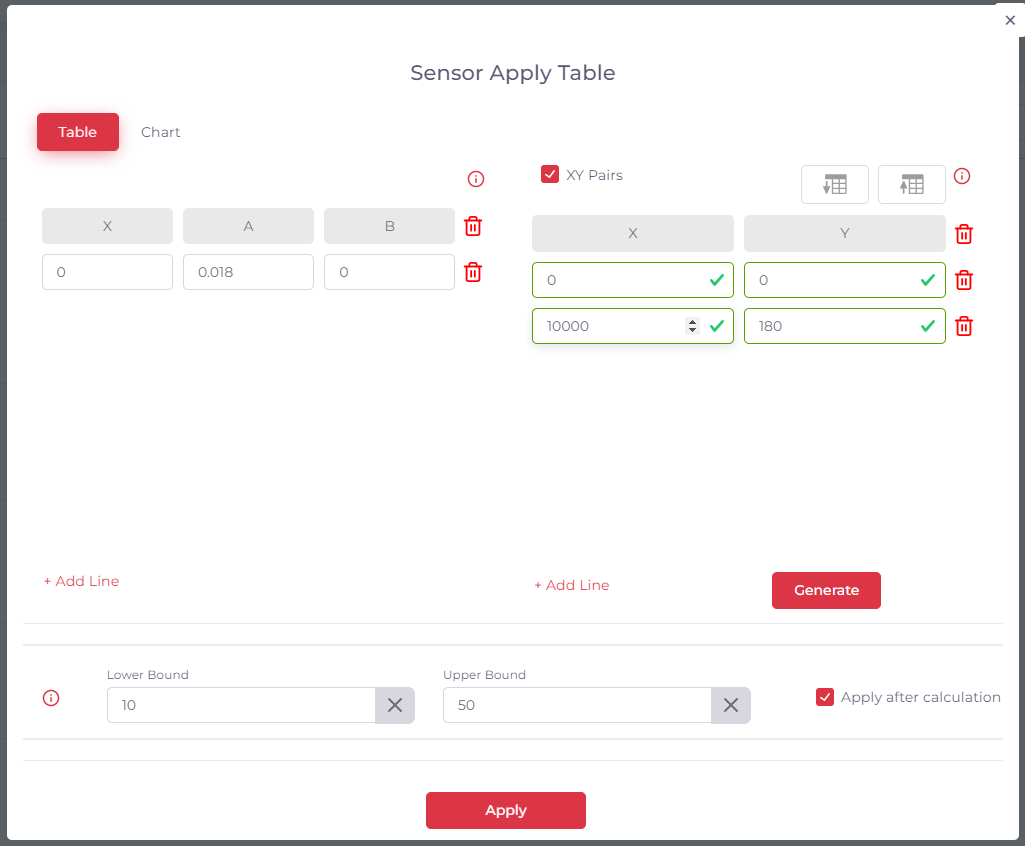
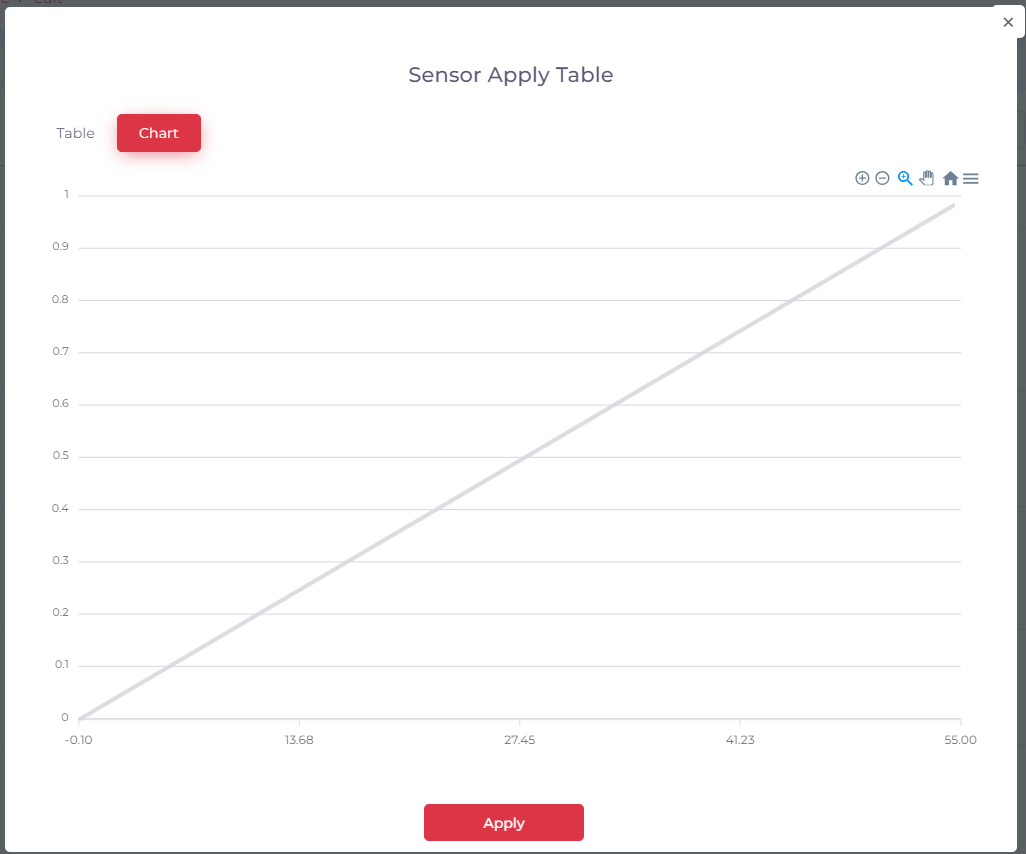
The calculation table interface is divided into two main tabs:
- Table
- Chart
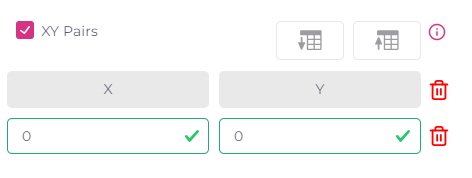
¶ XY Pair Checkbox
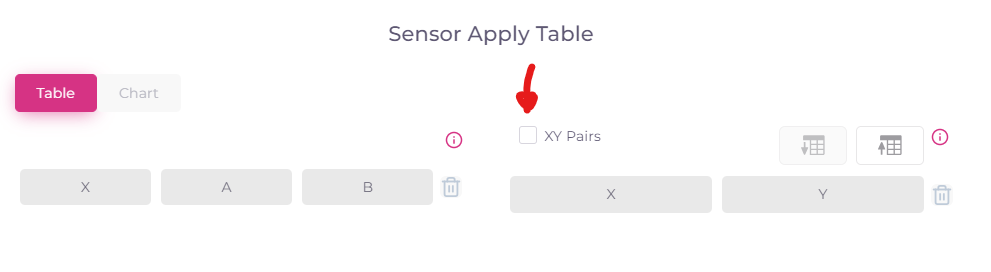
- Checked: Allows you to input X and Y values directly.
- Unchecked: Disables direct input of X and Y values.
¶ Upload Table
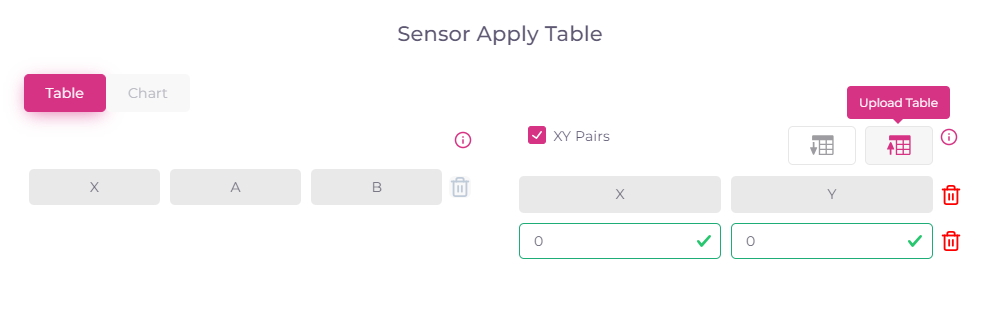
- Allows you to upload a CSV file containing XY values.
¶ Download Table
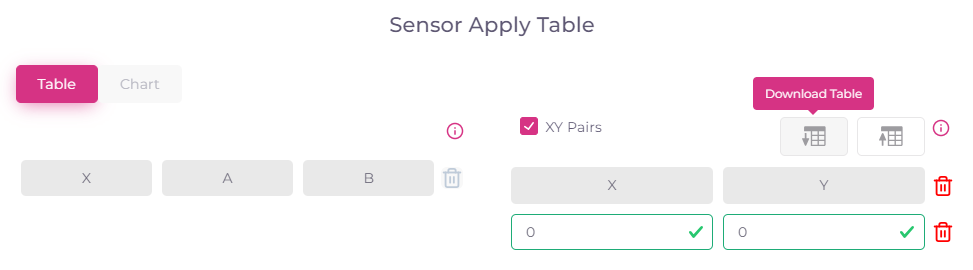
- Download your current XY values as a CSV file.
¶ Add Line Button
- Use this button to add more values to your table.

¶ Delete Button
- This button allows you to delete specific lines or all values in the table.
¶ Generate Button
- Converts your X and Y values into X, A, and B using the formula:
Y = aX + b.

¶ Bound Values
You can set limits for your data:
- Lower Bound
- Upper Bound

¶ Applying Calculations
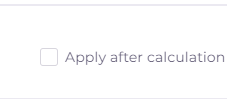
- Apply After Calculation Checkbox:
- Checked: The system considers Y values, and the lower and upper bounds apply to the Y axis.
- Unchecked: The system considers X values, and the lower and upper bounds apply to the X axis.
¶ Graph Visualization
Once you enter your values, a graph is automatically generated to visualize the data. The graph shows how your data fits within the defined bounds, ensuring that only data within these bounds is considered valid.
¶ Finalizing the Configuration
After configuring your table and verifying the data on the graph, click the Apply button to save the configuration.
This feature ensures that your sensor data is accurately processed and visualized, allowing for better sensor performance and decision-making.