The Calibration tab converts a sensor field's raw value into a usable value, from points you measured. It shares a dialog with the Conditional tab, which decides which raw value the field takes. For the ideas behind it, see Calibration tables.
¶ Open the dialog
On a device's Sensors tab, select Edit on the sensor's row. In the Telemetry mapping group, select Calibration table under the field. The dialog opens on the Calibration tab.
Calibration table shows only under fields that hold numbers. The tick beside it shows that the field already has segments.
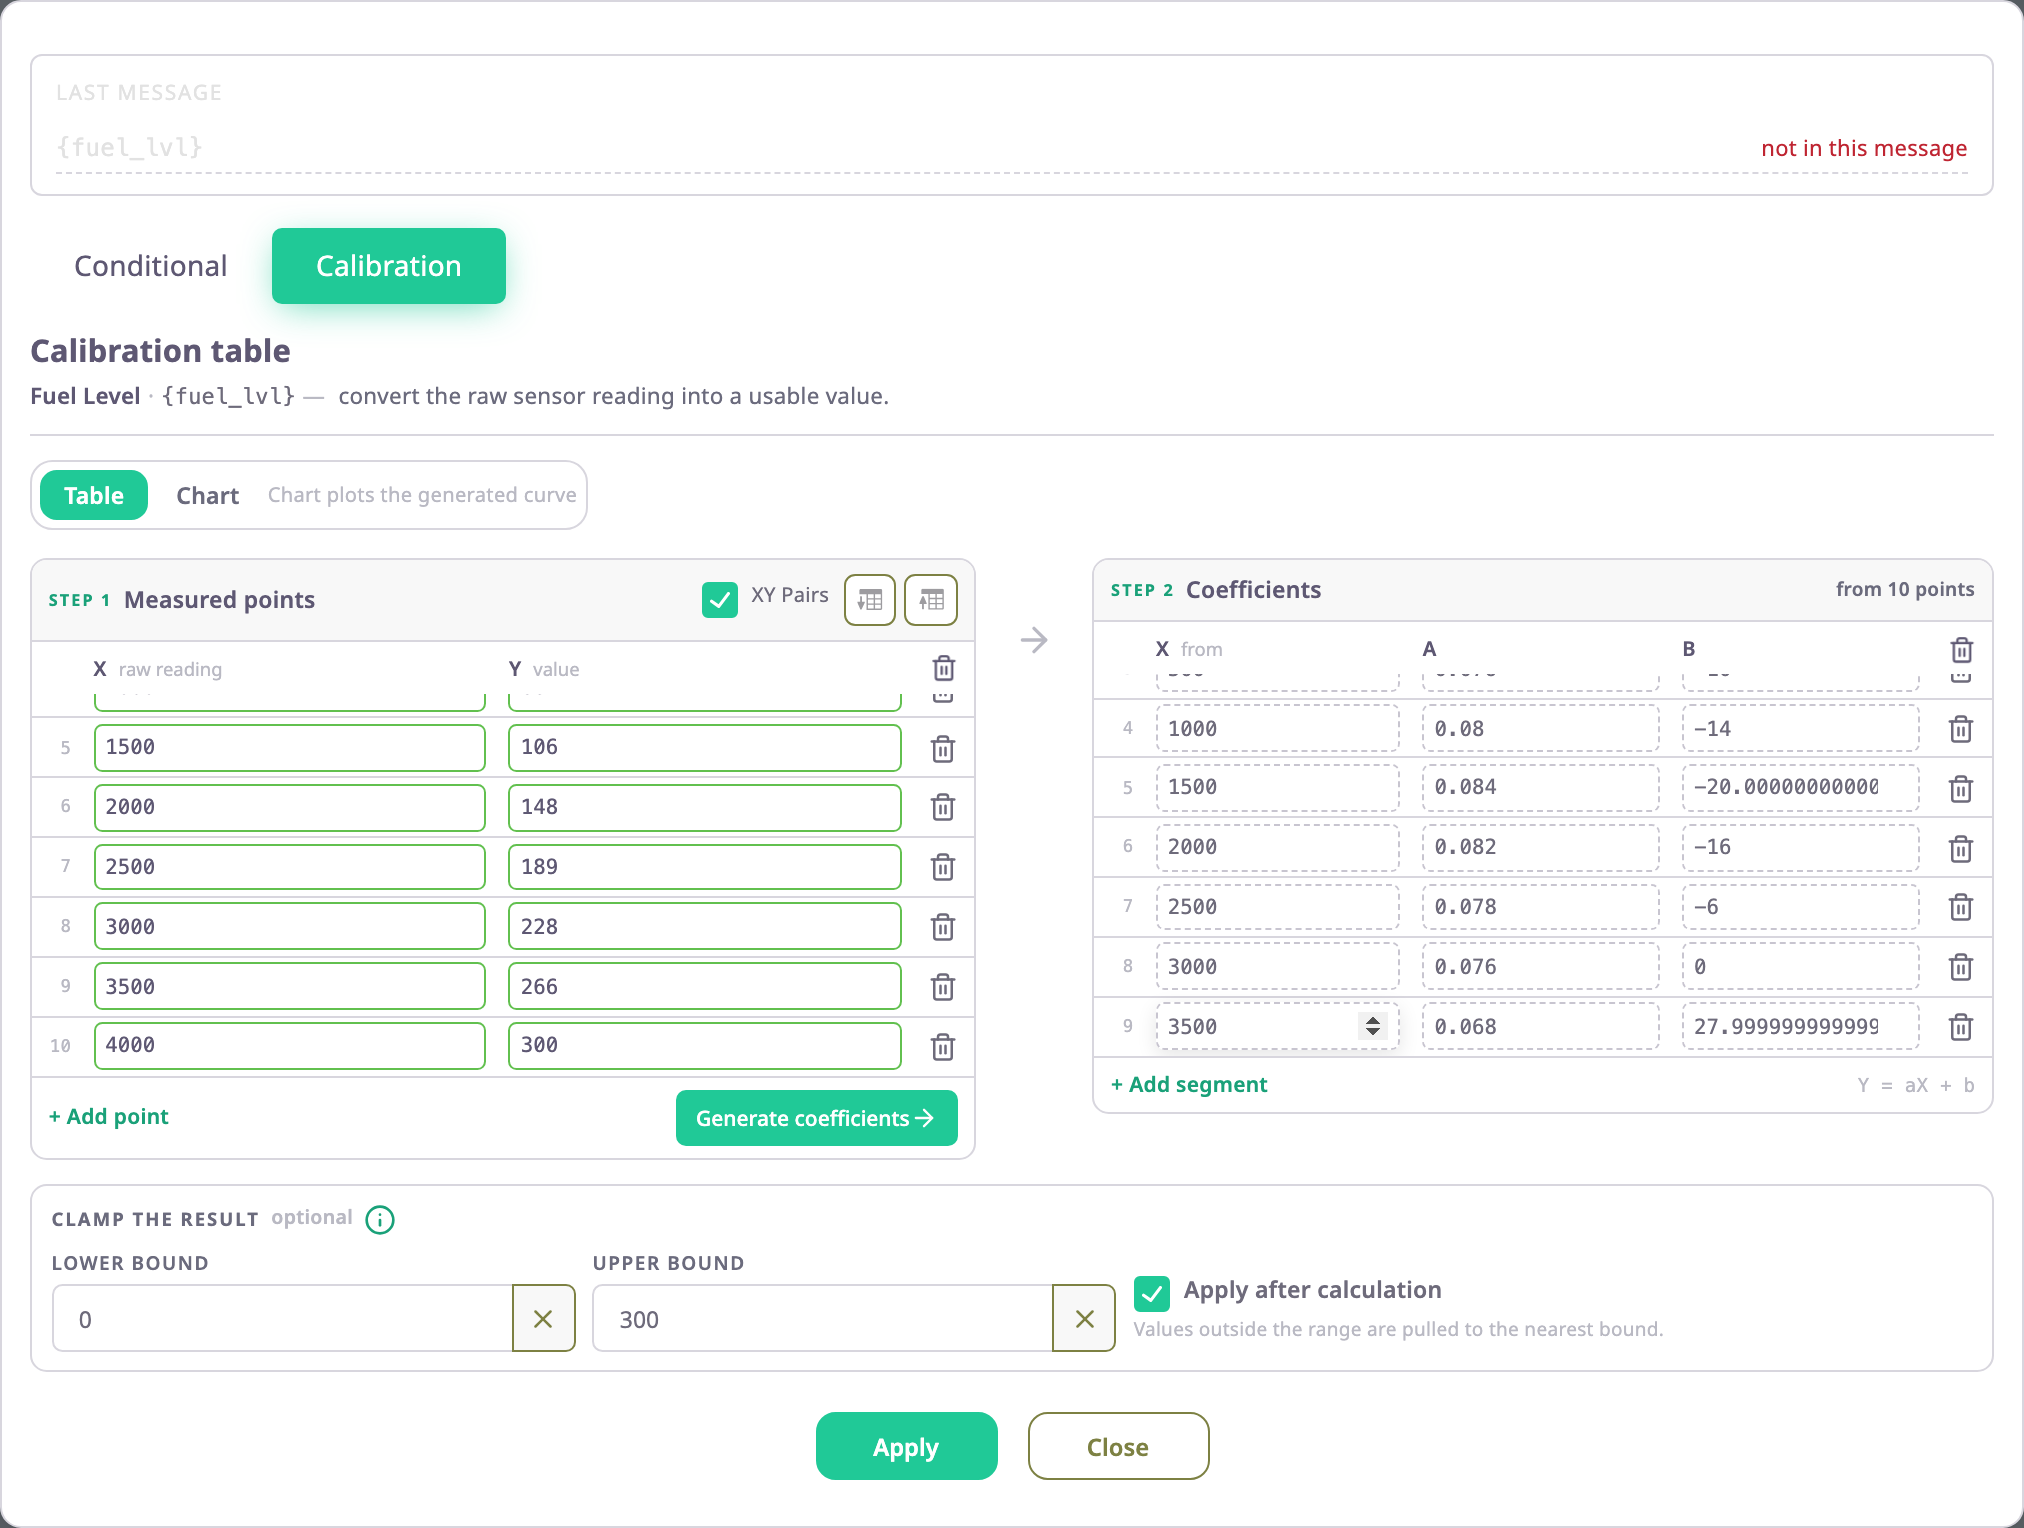
The top of the dialog lists the parameters the field reads, with their values in the device's last message. Under the title, the dialog names the field and its expression, for example "Level · {fuel_lvl}".
¶ Step 1: Measured points
The left panel holds the pairs you measured. Each row is one point.
| Field | Required | What it does | Allowed values / example | Notes |
|---|---|---|---|---|
| XY Pairs | No | Turns this panel on. Off, the panel dims and you write the segments yourself. | On or off | Upload Table turns it on. |
| X (raw reading) | Yes | A reading the sensor sent while you measured. | Any number, each X once. Example: 2000 | A repeated X shows "Duplicate x value found at line N: X". |
| Y (value) | Yes | What that reading means, in the sensor's unit. | Any number. Example: 148 | A row needs both X and Y. |
Add point adds a row. The bin icon on a row removes that point; the bin icon in the header removes all points. Download Table and Upload Table save and load the points as a file; see "CSV format" below.
Generate coefficients sorts the points by X and writes the segments into Step 2, replacing what was there. It needs at least two points: with one point it writes nothing. It stays off while two points share an X or a row is half filled.
¶ Step 2: Coefficients
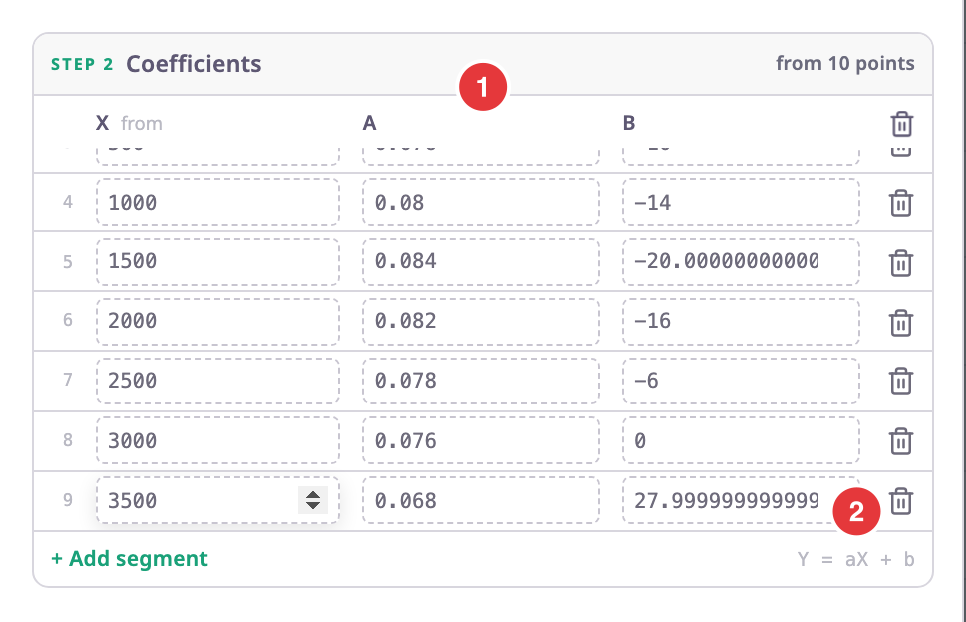
The right panel holds the segments the app applies. Each row is one straight line, Y = aX + b, that starts at its X. "from N points" in the header says how many points the segments came from.
| Field | Required | What it does | Allowed values / example | Notes |
|---|---|---|---|---|
| X (from) | Yes | Where the segment starts. | Any number, each X once. Example: 200 | Generate writes one segment per pair of neighbouring points, starting at the lower one. |
| A | Yes | The slope: how much the value grows per step of the reading. | Any number. Example: 0.063333 | Generate writes (Y2 - Y1) / (X2 - X1). |
| B | Yes | The line's value at a reading of 0. | Any number. Example: -3.666667 | Generate writes Y1 - A × X1. |
Add segment adds a row you fill in by hand, and the bin icons remove one or all segments. Apply stays off while a row lacks X, A or B: "Every coefficient row needs an X, an a and a b". With no segments at all, the dialog says "Generate the coefficients, or add a segment by hand, before applying".
¶ How the app applies the segments
For each message, the app takes the value the field's expression gives. It then uses the segment with the highest X that is not above that value:
- Between or on the points: the value follows the segment's line. With the ten-point fuel table in the screenshots, a reading of 2000 gives 148 l.
- Below the first segment's X: the value is 0.
- Above the last point: the last segment's line continues. A reading of 4100 on the same table gives 306.8 l, more than the tank holds. Set an upper bound to stop that.
¶ Clamp the result
The optional bounds under the panels set the range of acceptable values.

| Field | Required | What it does | Allowed values / example | Notes |
|---|---|---|---|---|
| Lower Bound | No | Discards values below it. The field has no value for that message. | Any number, not above Upper Bound. Example: 0 | The app keeps the bound value itself. The cross clears it. |
| Upper Bound | No | Discards values above it. The field has no value for that message. | Any number, not below Lower Bound. Example: 300 | The app keeps the bound value itself. The cross clears it. |
| Apply after calculation | No | Off: the bounds test the value before the table converts it. On: they test the converted value. | On or off | Off for a new table. |
The dialog's hint says "Values outside the range are pulled to the nearest bound." That is not what happens. The app discards a value outside the range, as the info icon beside the heading says. A discarded value leaves a gap in the unit card, charts and reports; it never shows as the bound. If the lower bound is above the upper one, the dialog shows "Upper bound should be greater than lower bound." It also turns Apply and the chart off.
Which setting to choose: take a fuel probe that sends 0 to 4000. To drop broken readings, leave Apply after calculation off and set the bounds to 0 and 4000. To drop results above the tank's size instead, turn it on and set Upper Bound to the capacity in litres.
¶ Chart
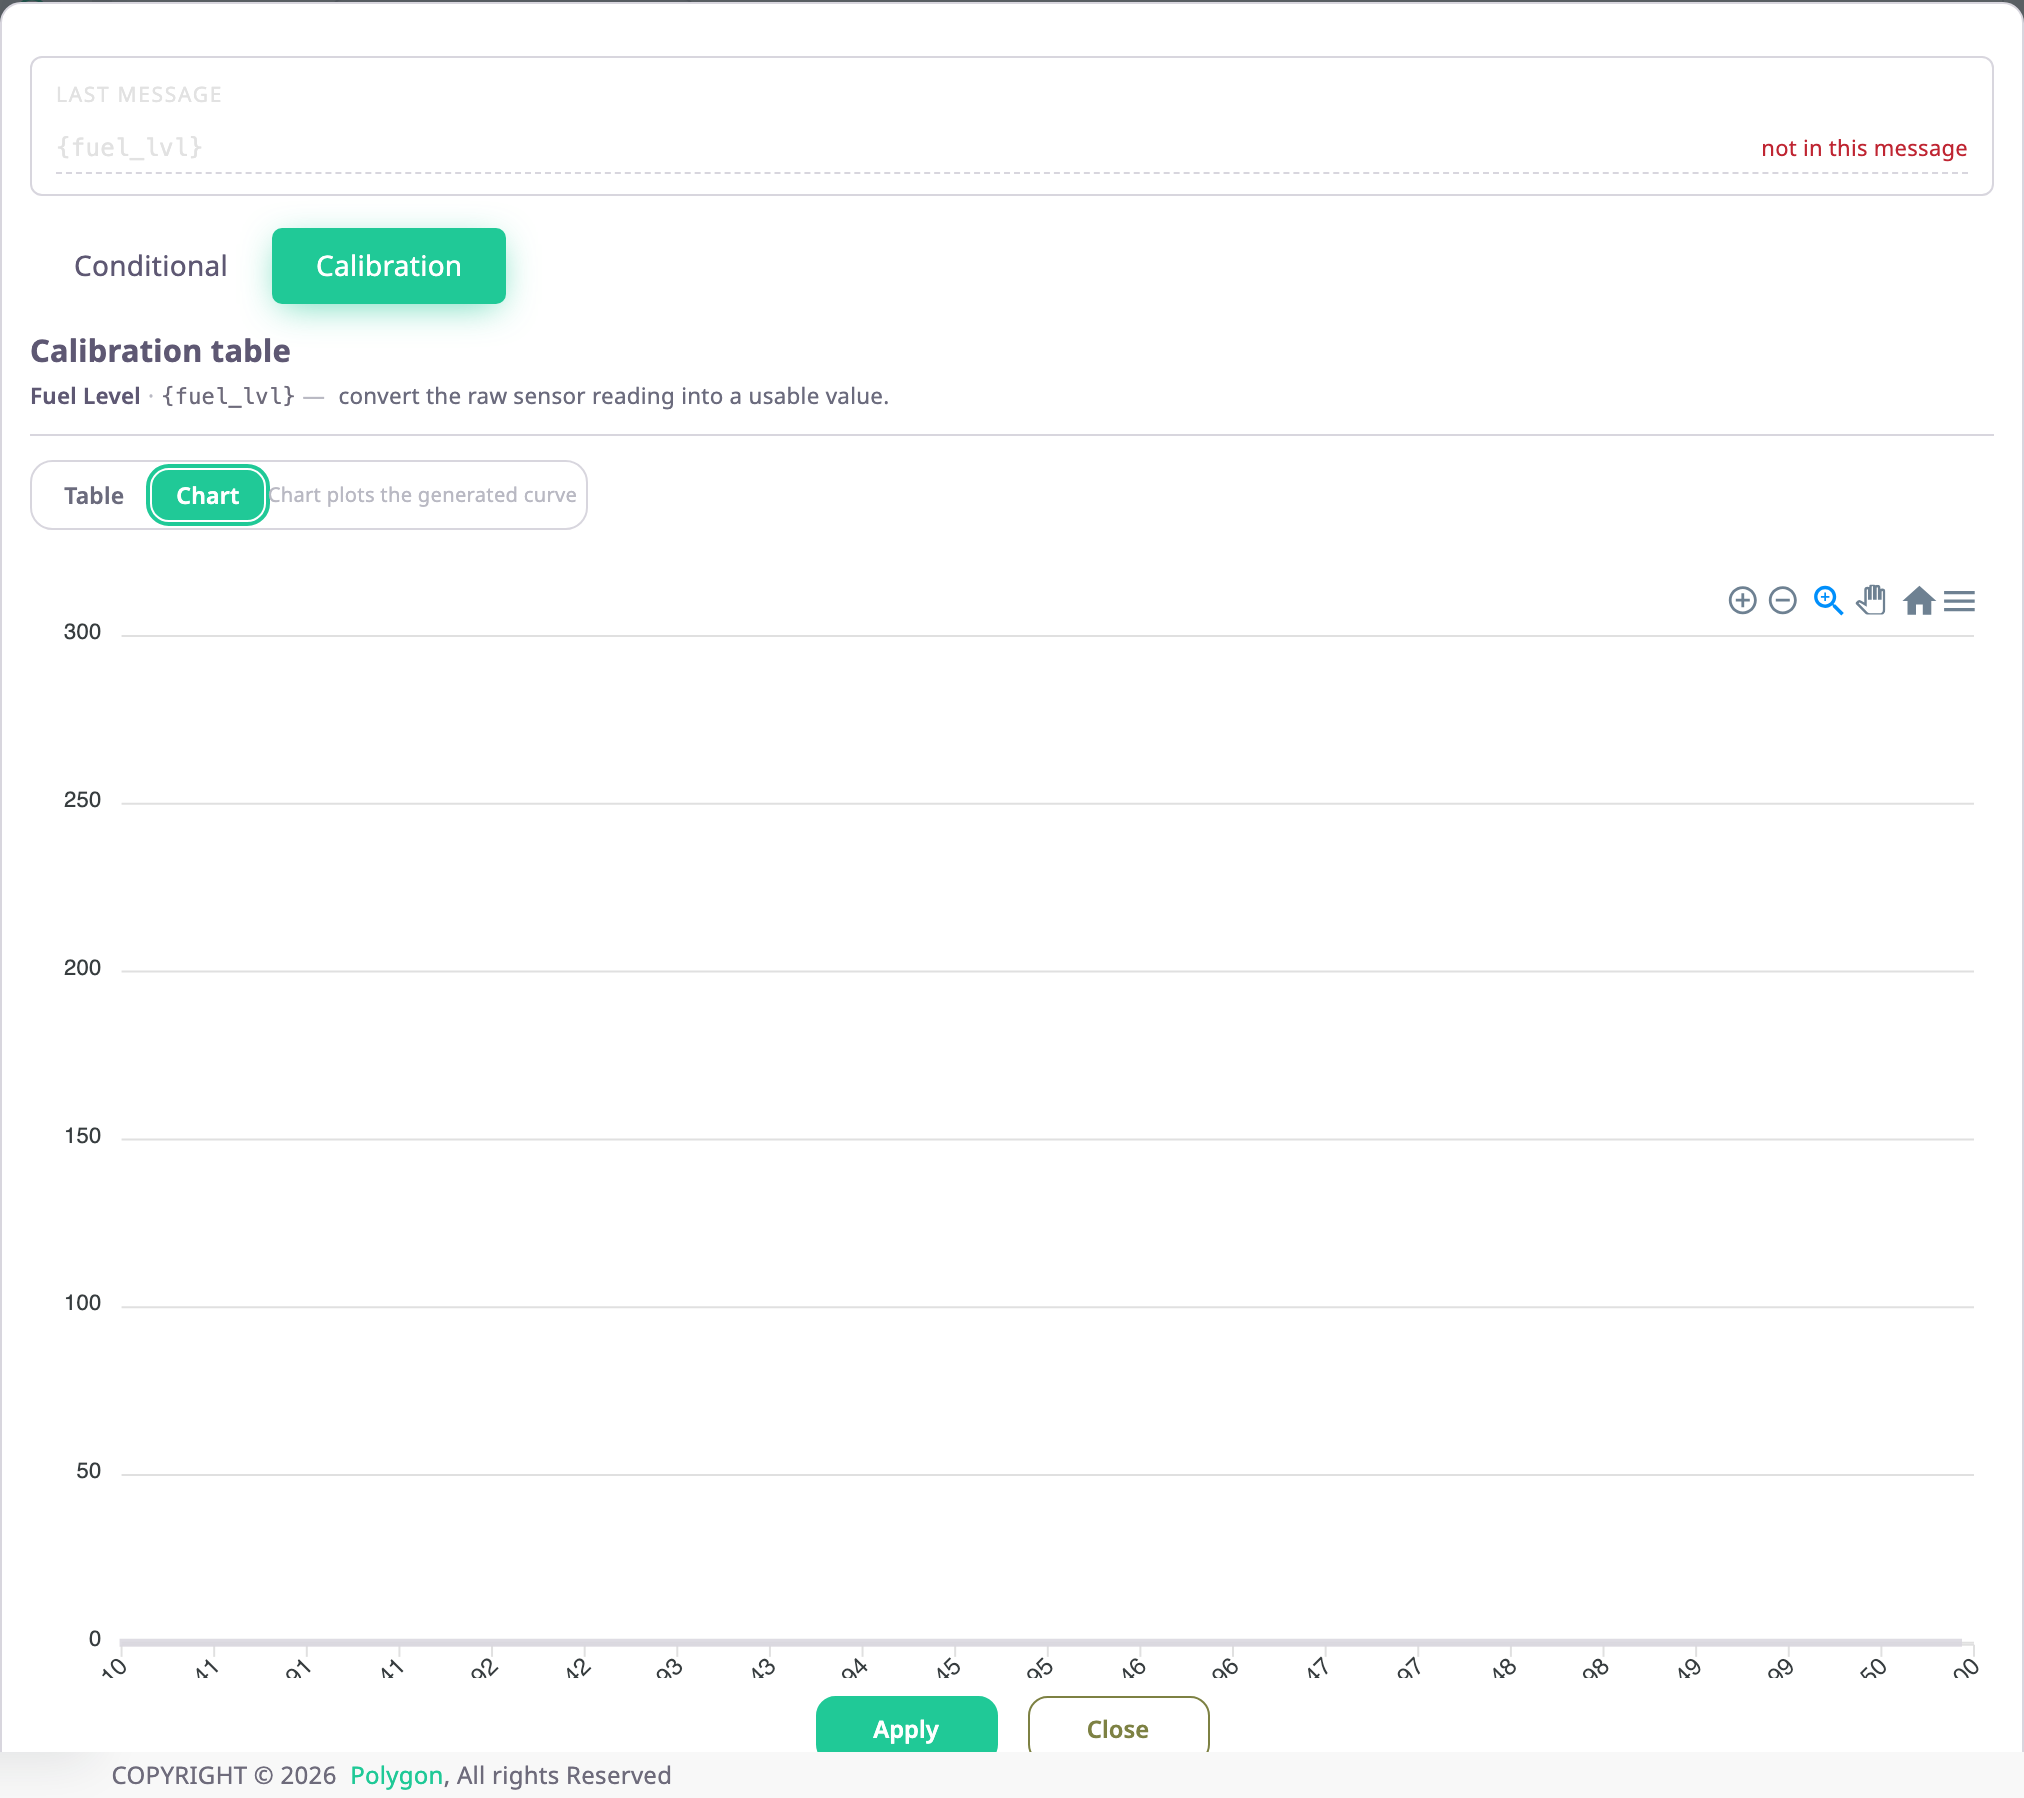
The Chart tab draws the segments as one line, from a little below the first X to a little above the last. With Apply after calculation off, it marks the bounds on the reading axis; on, on the value axis. The tab is off until there is at least one segment.
¶ CSV format
Upload Table reads a file whose name contains .csv. Each line holds one point: the reading, a semicolon or comma, then the value. There is no header line, and the app skips blank lines. Download Table writes the same format with semicolons.
0;0
200;9
500;28
1000;66
The upload replaces the measured points and turns XY Pairs on. Select Generate coefficients afterwards; the upload does not.
¶ Buttons and messages
| Action | What happens |
|---|---|
| Apply | Closes the dialog and hands the segments, the points, the bounds and the expression from the Conditional tab to the sensor dialog. The app stores them when you select Save in the sensor dialog. |
| Close | Closes the dialog. The sensor dialog keeps its previous table. |
| Clear calibration table (on the Conditional tab) | Removes the segments and points so the field can take a condition. |
¶ Permissions
- You need the Edit permission of the Devices module to change a table. Only dealer accounts manage devices; the Owner role has the permission.
- On a device that opens view-only, every input is off and the dialog has no Apply. Close still works.