Use a calibration table when a sensor's raw reading does not follow its value in a straight line. A fuel probe in a shaped tank is the usual case. You enter the points you measured. The app builds the segments between them and converts every new message.
¶ Before you start
- You need a dealer account and the Edit permission of the Devices module. The Owner role has it.
- The device has the sensor already, and its field reads the bare parameter, for example
{fuel_lvl}. See Add a sensor. - You have the measured pairs: a raw reading and the value it means. Include the lowest and the highest reading the sensor can send. Readings below the first point become 0, and readings above the last point continue the last line.
- Optional: The pairs are in a
.csvfile, onereading;valuepair per line, with no header line.
¶ Enter the points
-
In the side menu, select Devices.
-
Select Edit on the device's row.
-
Select the Sensors tab.
-
Select Edit on the sensor's row.
The sensor dialog opens. -
In the Telemetry mapping group, select Calibration table under the field.
The dialog opens on the Calibration tab.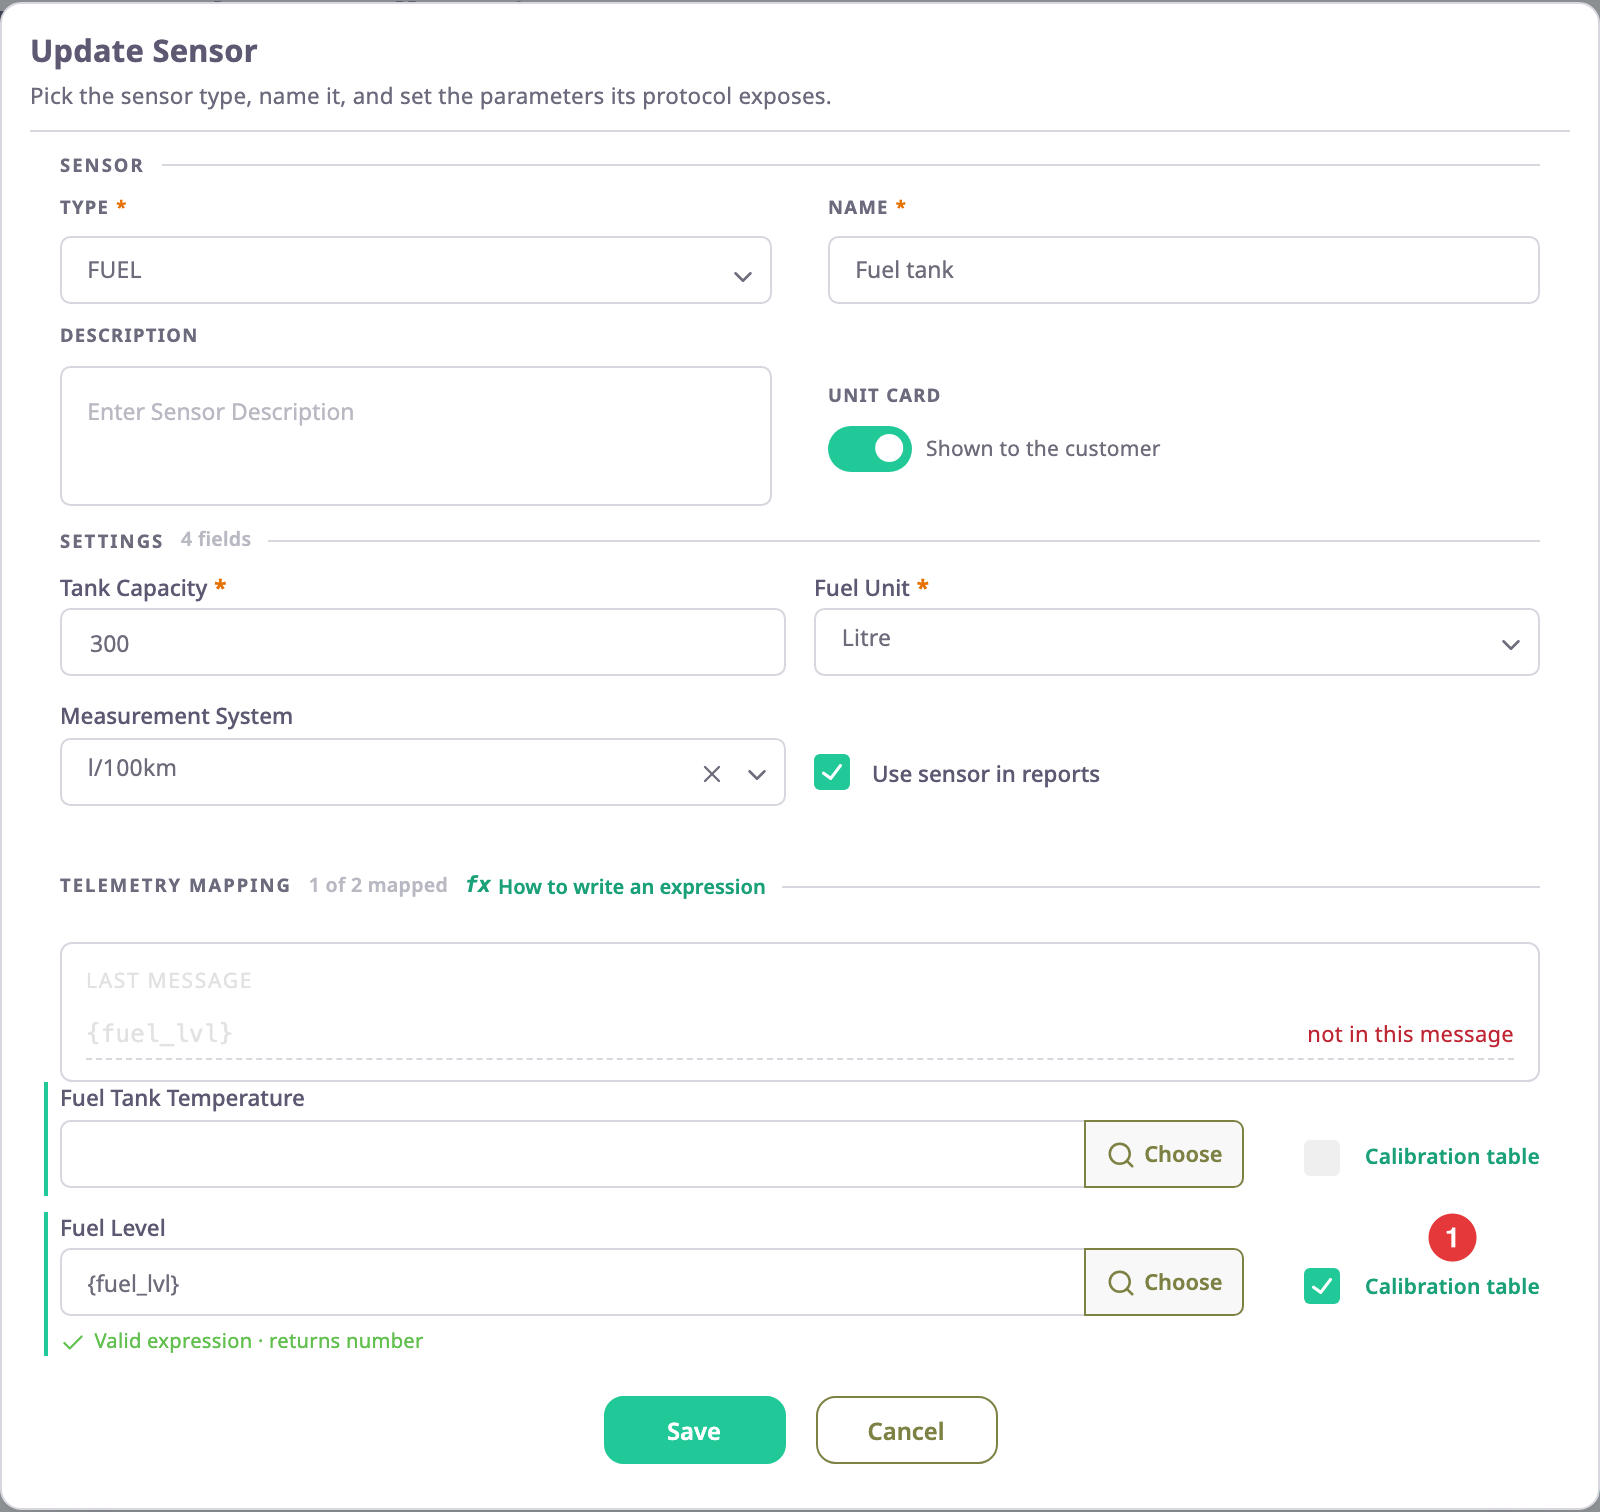
-
If the left panel is dim, select XY Pairs.
-
Select Upload Table.
-
Choose your
.csvfile.
The points appear in the left panel.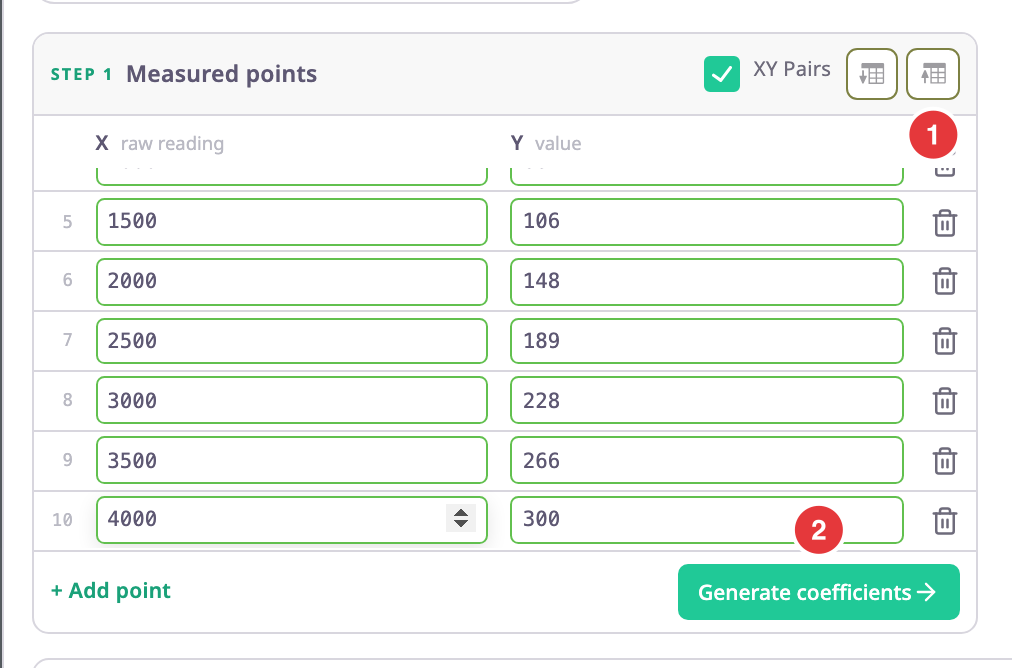
If you have no file, select Add point once for each pair. Enter the reading in X and the value in Y.
¶ Generate the coefficients
-
Select Generate coefficients.
The right panel fills with one segment per pair of neighbouring points, and "from N points" shows how many points it used.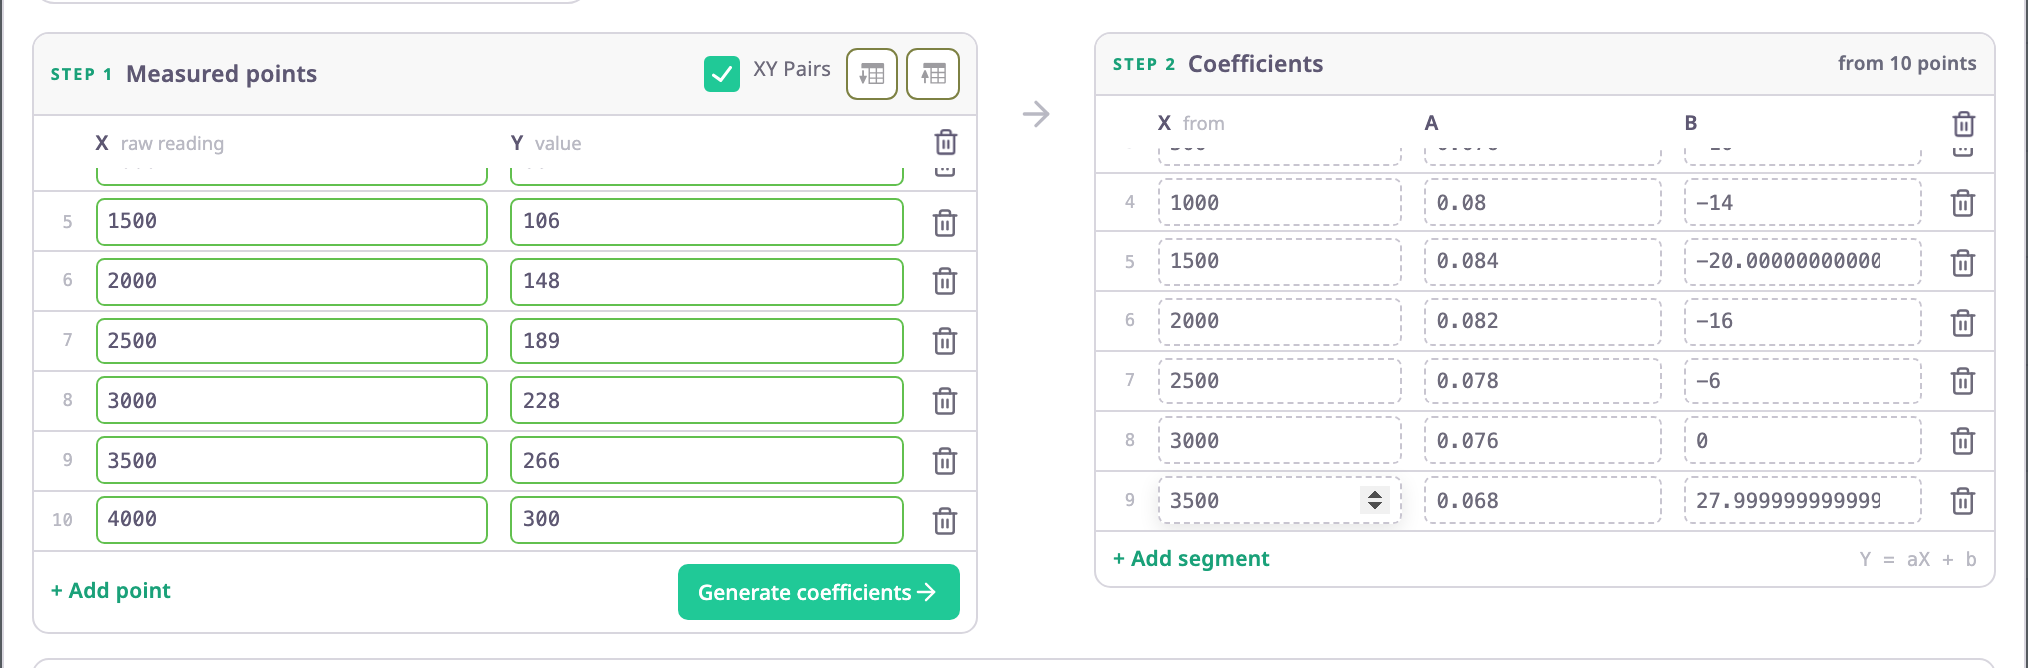
-
Optional: Select the Chart tab to check the line. It should rise or fall smoothly through your points.
If Generate coefficients stays off, two points share the same X, or a row has only one of its two values. Fix the row the message at the top names.
¶ Set bounds
Bounds are optional. The app discards a value outside them: the field has no value for that message.
- In Lower Bound, enter the lowest acceptable value, for example 0.
- In Upper Bound, enter the highest acceptable value, for example 4000.
- Leave Apply after calculation off to test the raw reading. Turn it on to test the converted value instead, for example to stop values above the tank's capacity in litres.
¶ Apply and save
-
Select Apply.
The dialog closes, and the tick beside Calibration table shows that the field has a table.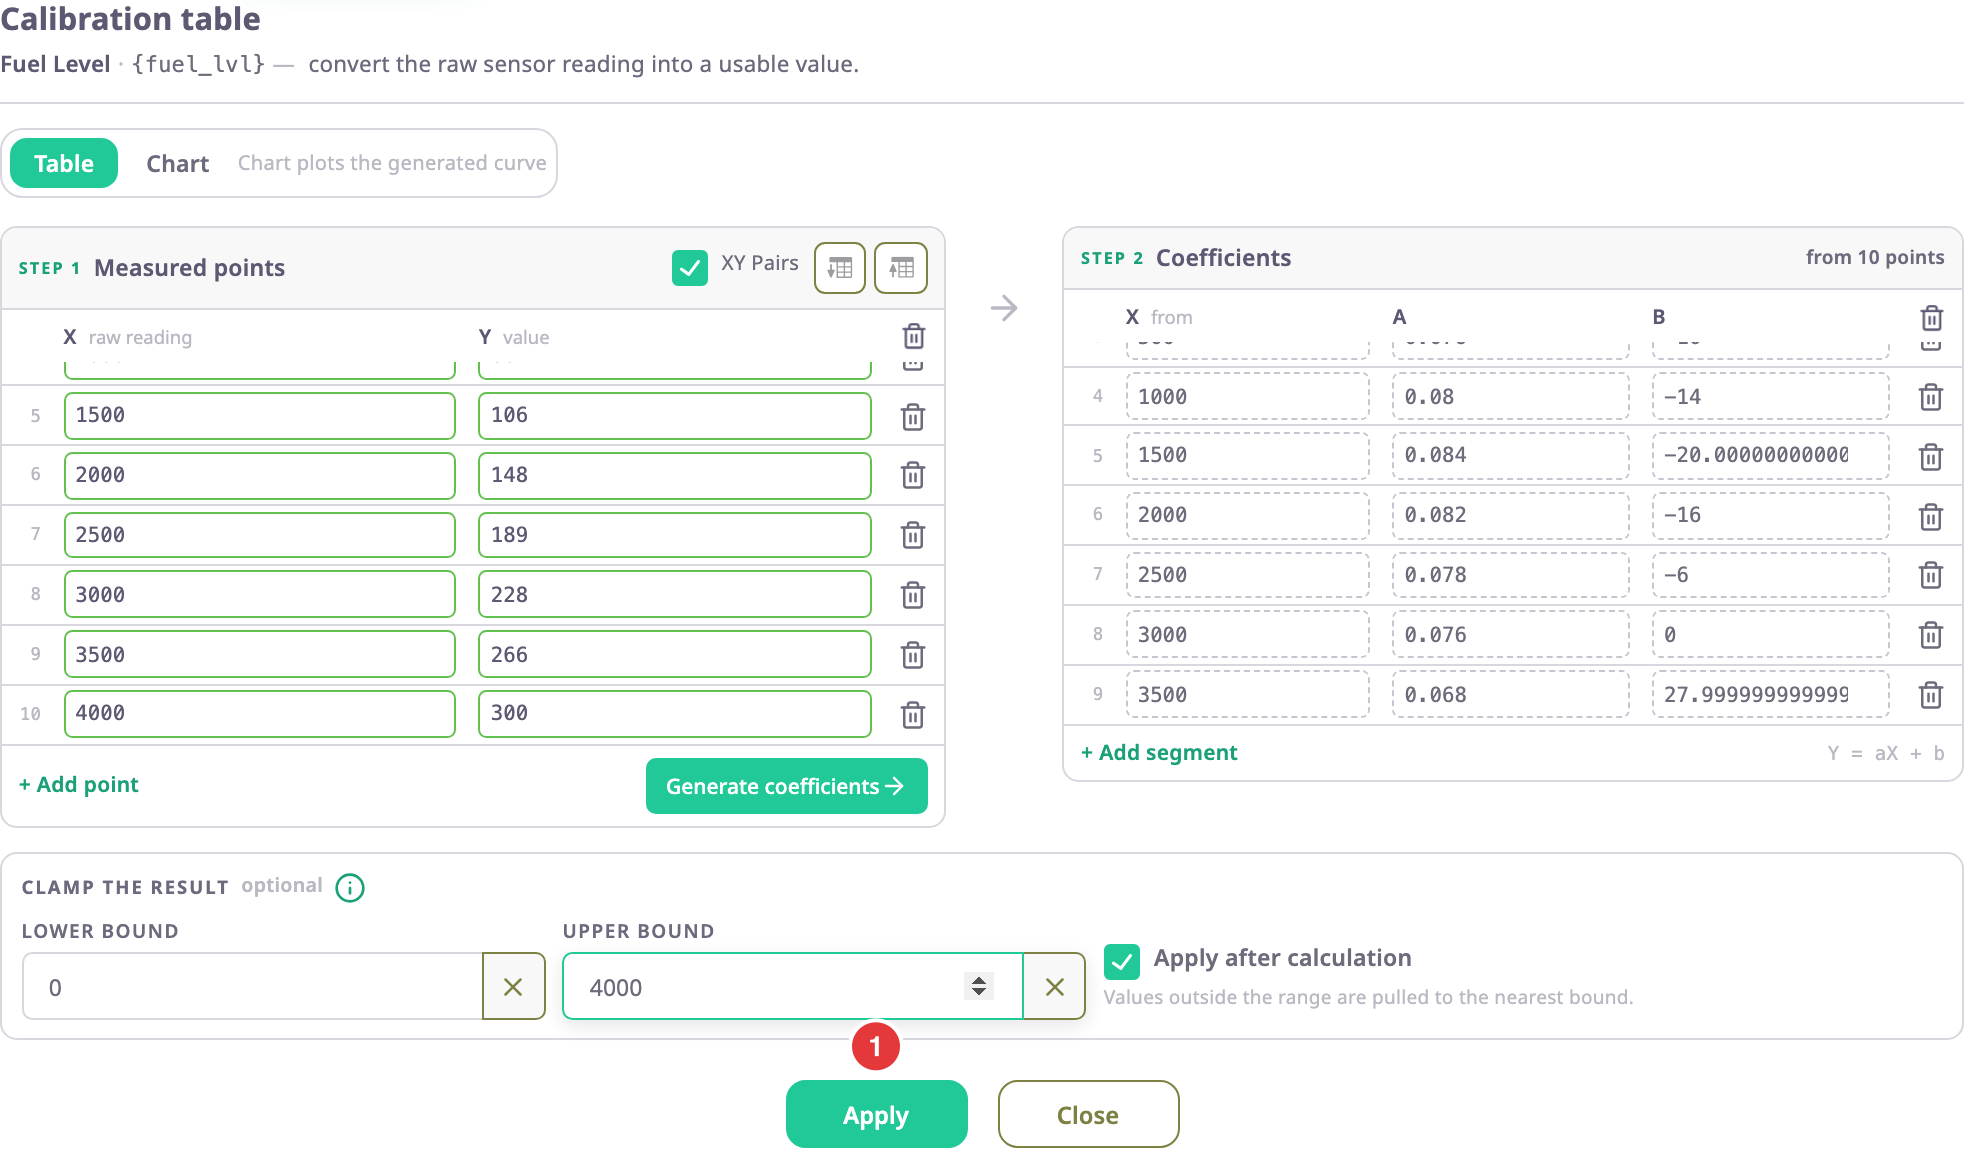
-
In the sensor dialog, select Save.
The app saves the sensor with its table.
¶ What happens next
The app converts the field with the table from now on. Open the unit card, or the unit's messages, after the device's next message to check the value. If the value is missing, the reading may be outside your bounds.
To add a condition to this field later, clear the table first on the Conditional tab, add the condition and calibrate again. See Sensor conditions.