One table reads one source. To show figures from a second source next to it, add a column from that source. For example, put parked time next to driving time per unit. The builder keeps a second table for it and matches its rows to yours by unit or driver, or by account for AI Assistant sources. You never write a join.
¶ Before you start
- Open the template in the builder and select Edit on the table to add to. See Report template builder.
- You need the Add template or Update template action of Reports, and the permission for both data sources.
- Group your table first, for example one row per unit. Matching works best when each row stands for one unit, driver, account or period.
- A table that combines several kinds, such as Fuel drains + Fuel refills, offers only the columns all its kinds record. Add column does not offer the other kinds as a source to match. See Group, filter and total report rows.
¶ Add a column from another source
-
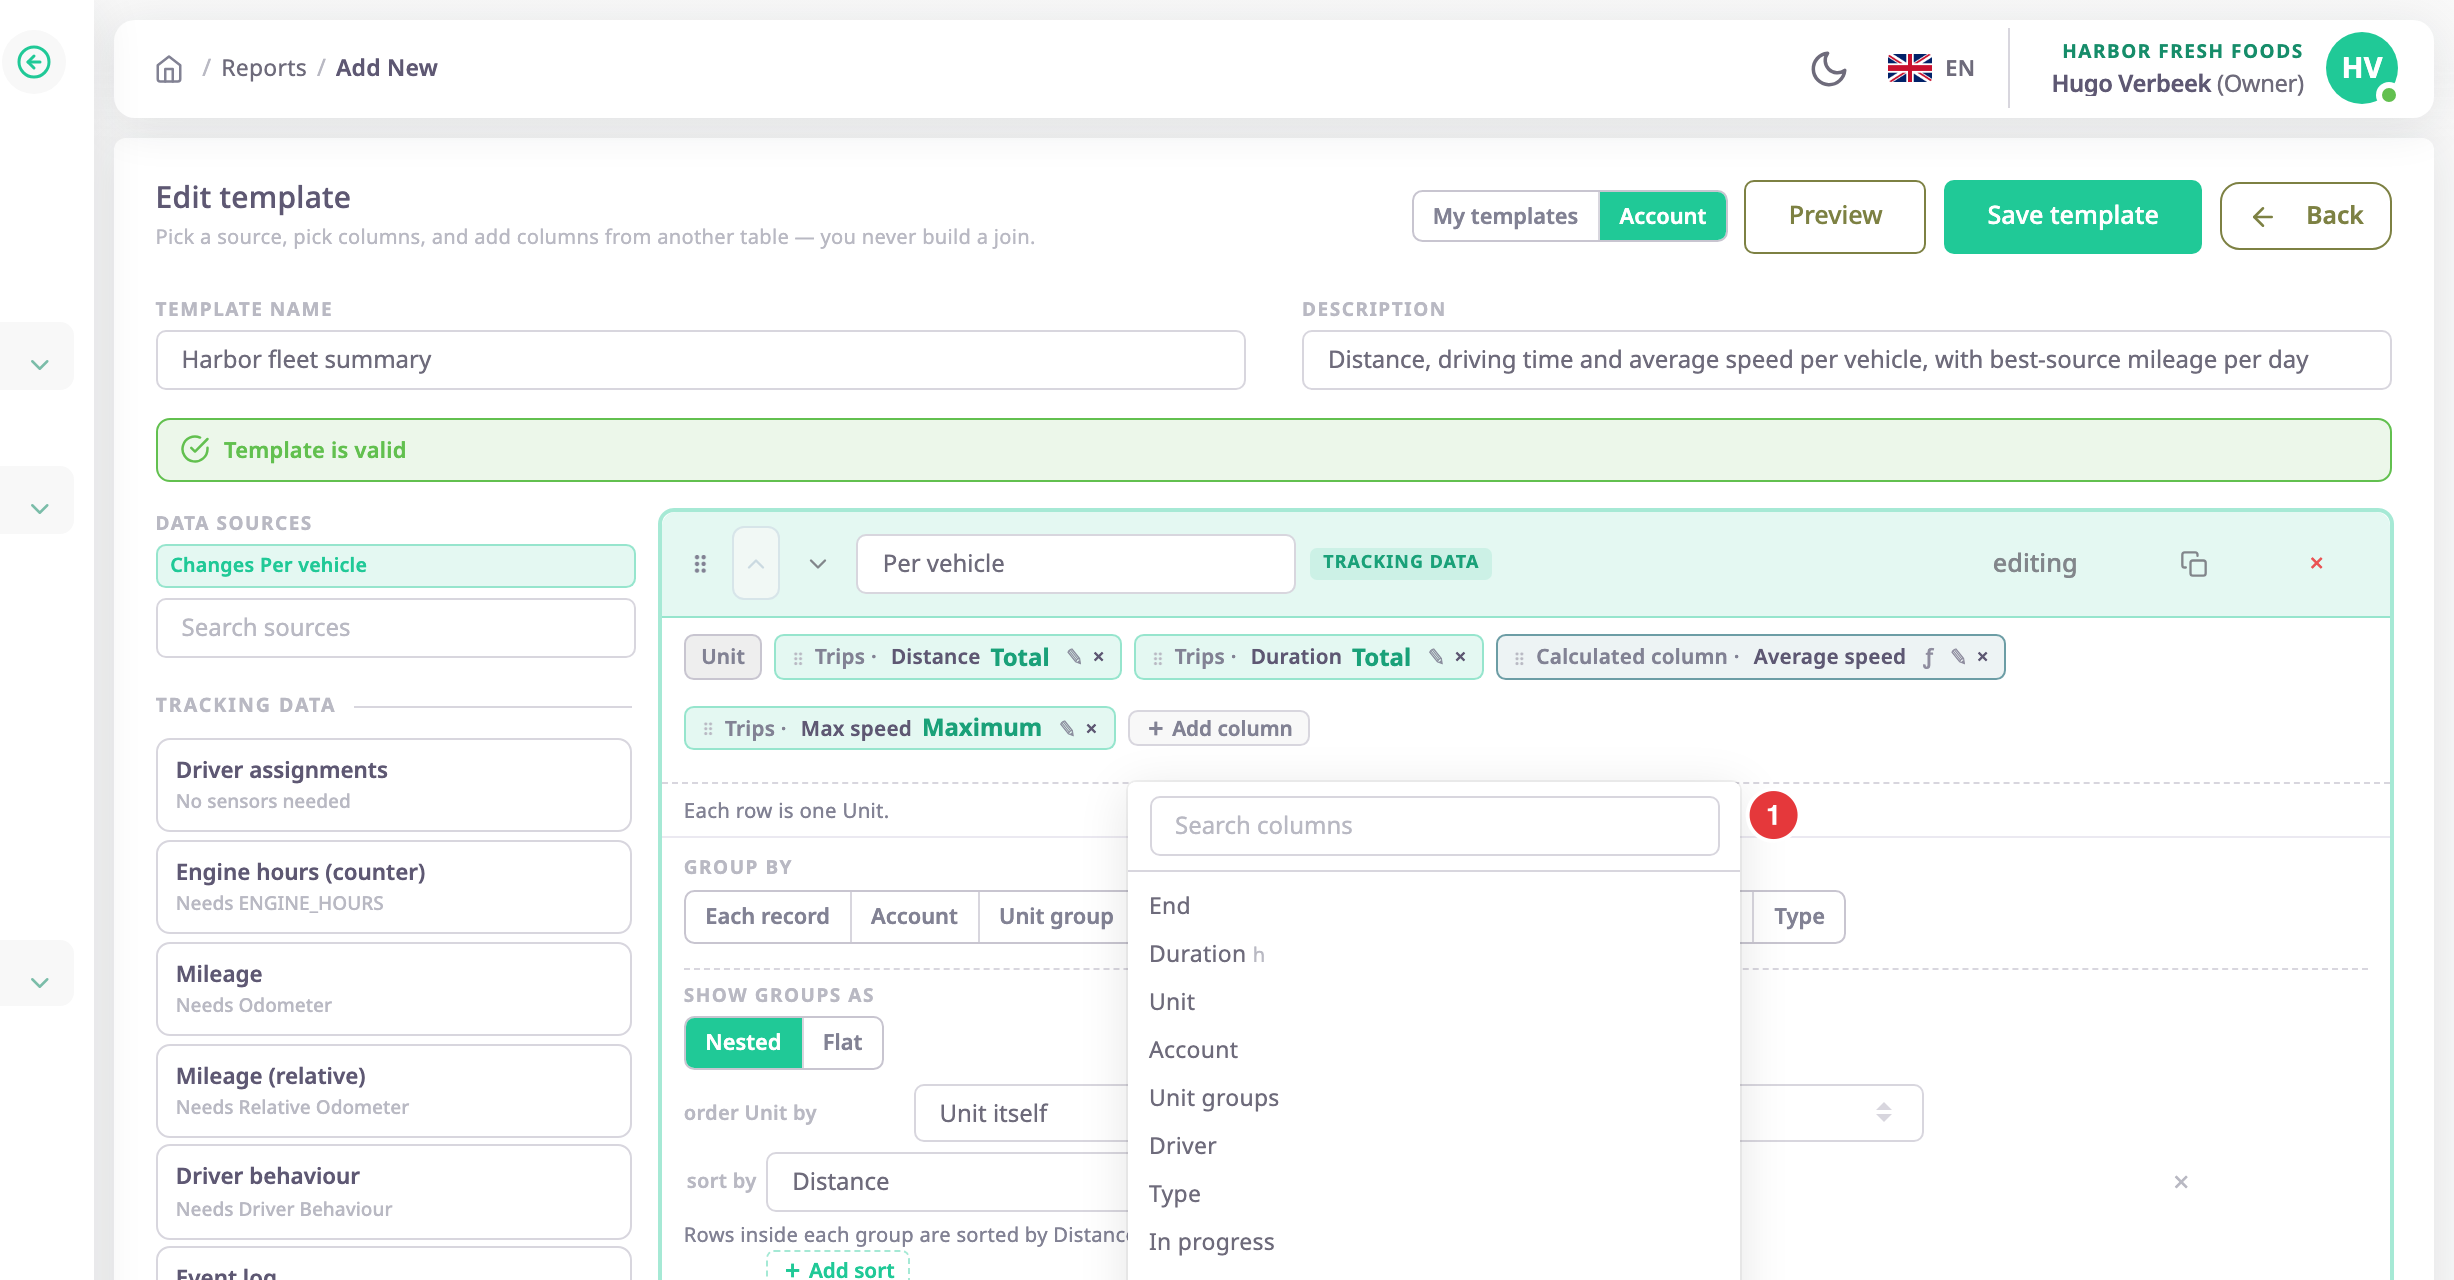
On the table, select Add column.
The column menu opens. -
Scroll past this table's own columns to the heading of another source, marked 1, for example "From Driver assignments".
-
Select the column.
The builder adds a table for that source if there is none, and the dialog How should these rows match? opens. -
Set the match. See the next section.
-
Select Match them.
The column appears on your table with a link mark (🔗) before its source name. The other table carries a tag saying which table it lends to.
¶ Change how tables match
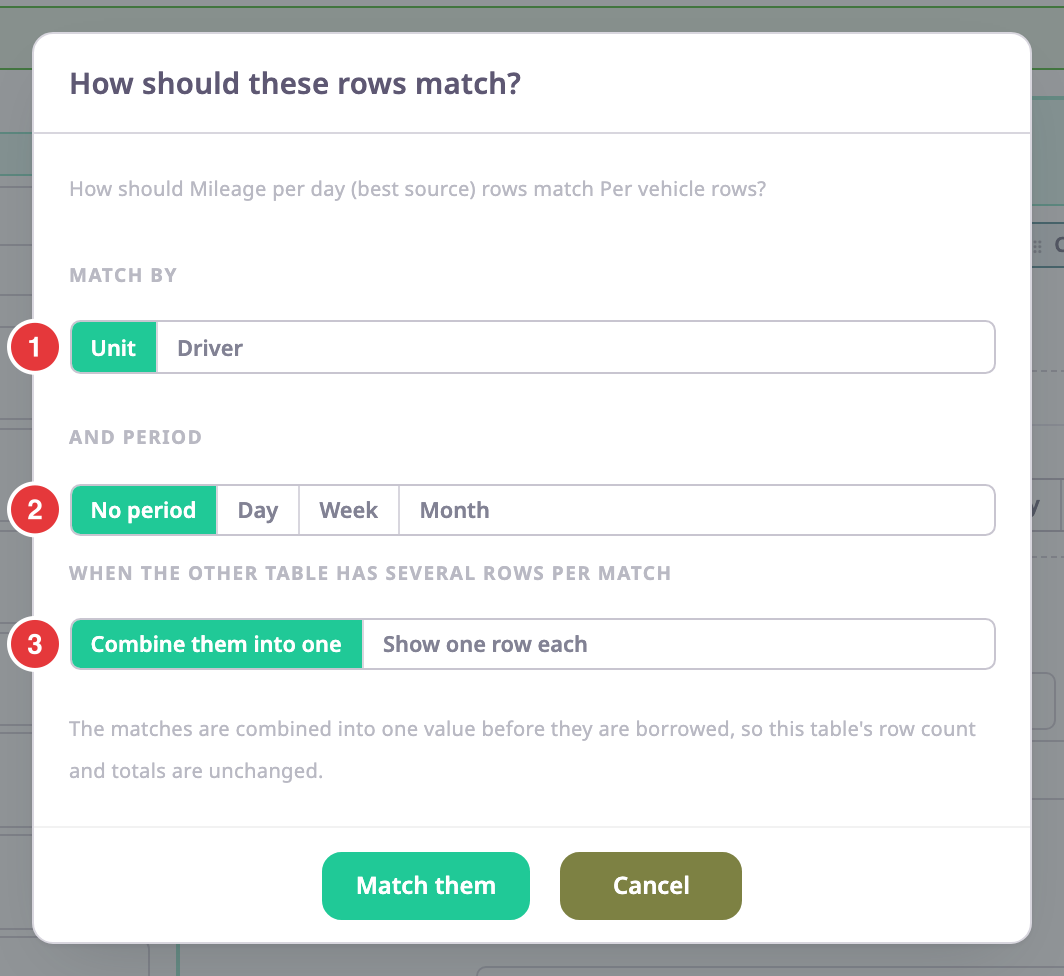
- In Match by, marked 1, choose Unit or Driver.
When both tables read AI Assistant sources, such as AI usage and AI access & grants, the only choice is Account. The builder groups the other table by account. - In And period, marked 2, choose No period to compare whole periods. Choose Day, Week or Month to match period by period.
- Under "When the other table has several rows per match", marked 3, choose:
- Combine them into one: Polygon folds the matches into one value. Your table's rows and totals stay the same.
- Show one row each: your row repeats once per match. Its own figures appear on the first row only, so nothing counts twice.
- Select Match them.
To change a match later, select change matching on the link line under the table's columns.
If you match by period, group both tables by that period. Otherwise the report stops with the error "Combined columns cannot be matched".
¶ Merge two tables
You can also match a whole table you already have.
-
Select Add table, and pick its source in Data sources.
-
Group it the same way as your first table.
-
On the first table, in Add columns from another table, marked 1, choose the second table.

The match dialog opens.
-
Set the match and select Match them.
To stop borrowing, choose Do not merge.
¶ Add a second table side by side
If the two sources need no matching, leave Add columns from another table at Do not merge. The report then shows both tables one under the other, each with its own rows and totals. Use the arrows in a table's header to change the order.