A table that lists every trip suits a check of one day. For a week or a month, fold the trips into one row per unit or per day. Then total the columns and put the headline figures on cards. This page shows how, in the template builder.
¶ Before you start
- Open the template in the builder. See Create a report template.
- You need the Add template or Update template action of Reports. The Owner role has both.
- In the builder, select Edit on the table you want to change. Its settings open below its columns.
¶ Choose one row per
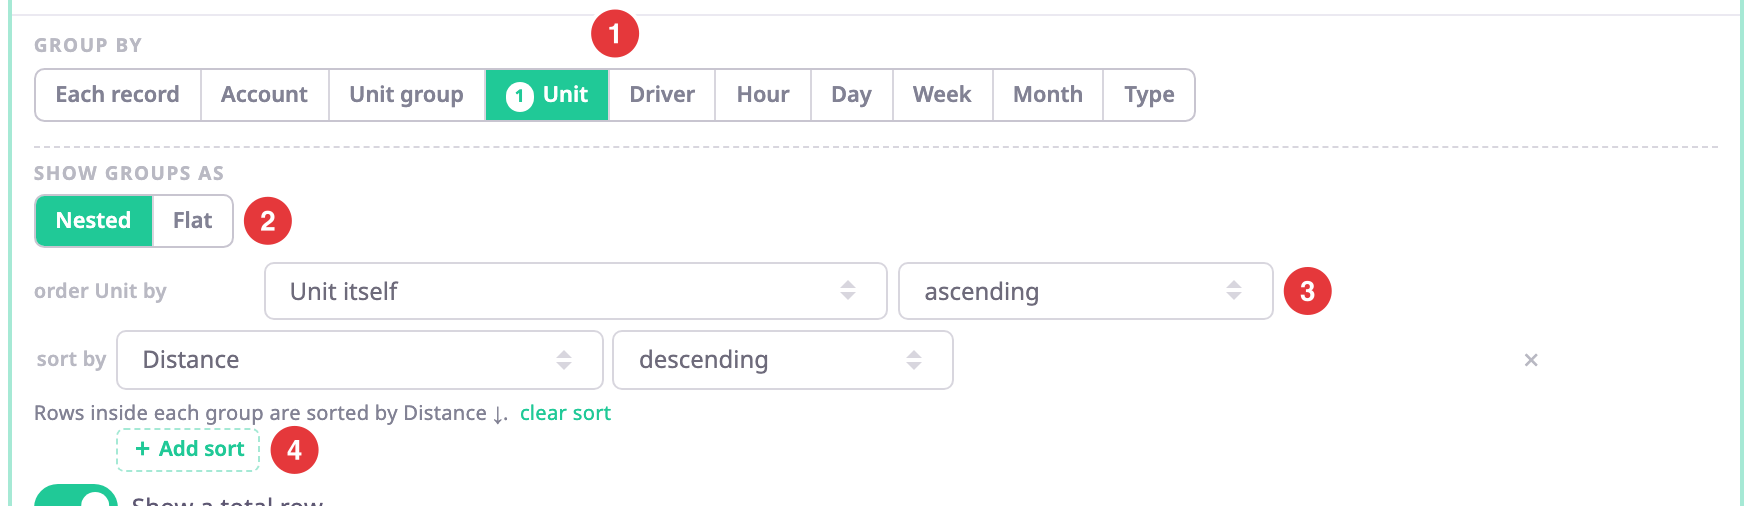
- Under Group by, marked 1, select the key to fold records by, for example Unit, Driver or Day.
The sentence under the columns changes to "Each row is one Unit." Each column gets a way to fold, such as Total for distance or Maximum for top speed. - Optional: Select a second key to nest it inside the first. The number on each key is its level.
- Optional: Under Show groups as, marked 2, choose Nested to show each group as a row you can fold open, or Flat for plain rows.
- Optional: Next to each level, marked 3, choose what orders the groups and ascending or descending.
- Optional: Select Add sort, marked 4, to order the rows inside each group.
To go back to one row per record, select Each record. The keys you can choose depend on the table's source.
¶ Choose how each column folds
In a grouped table, each column chip shows how it folds, for example Total. To change it:
-
Select the word on the chip.
-
Choose Total, Average, Minimum, Maximum, Count, First or Last.
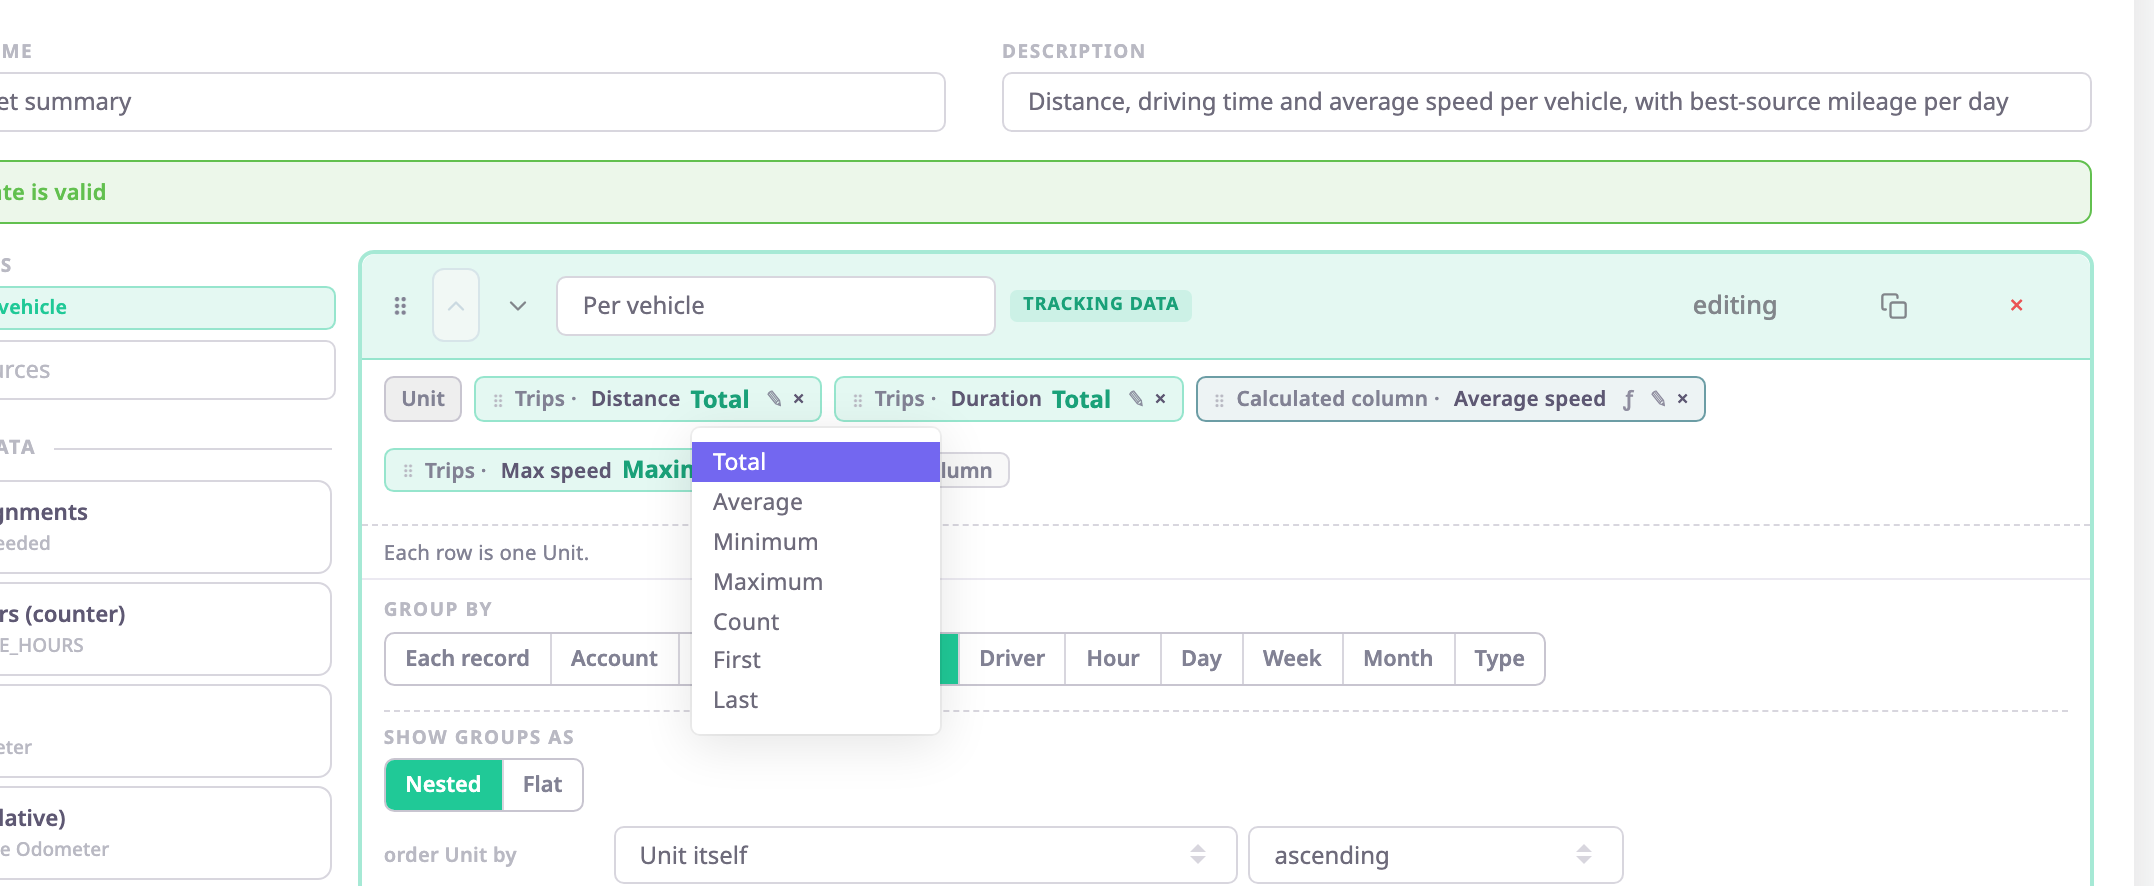
There is no separate "number of records" column. To count trips per unit or per day, set a column such as Unit to Count.
¶ Set totals, including begin and end
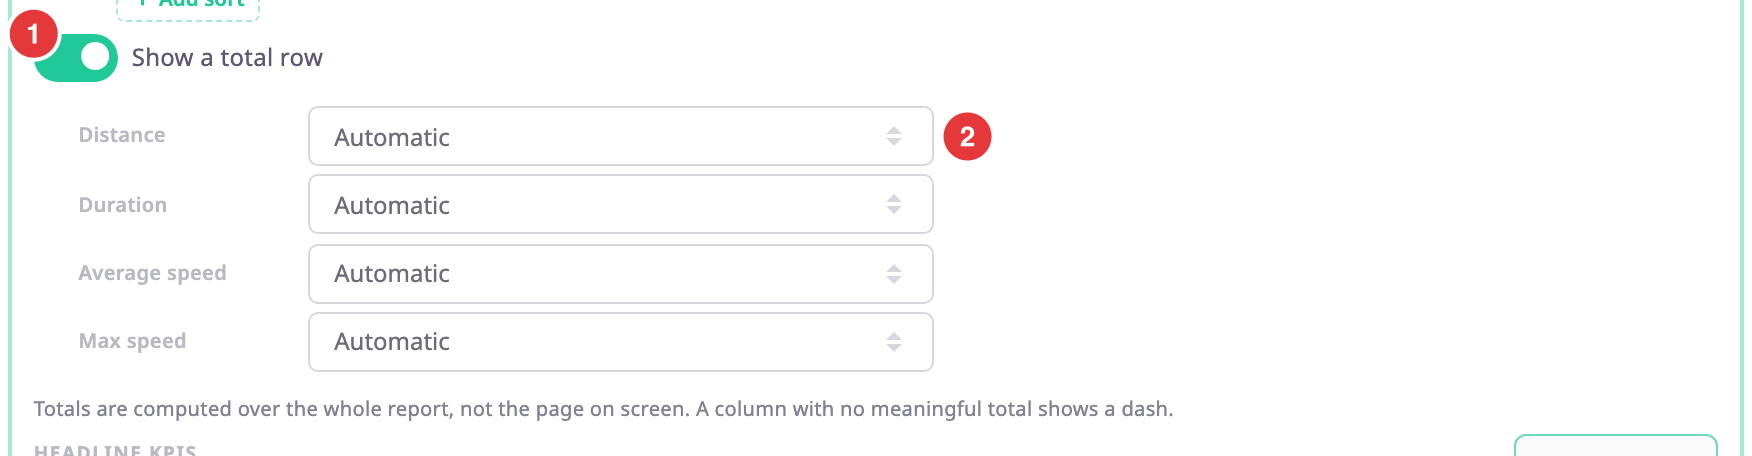
- Turn on Show a total row, marked 1.
- For each column, marked 2, choose how it totals:
- Automatic uses the column's own way of folding.
- Total, Average, Minimum, Maximum or Count.
- Begin or End takes the value of the earliest or latest record, for example an odometer reading at the start of the period.
- No total leaves the cell empty.
Totals cover the whole report, not the page on screen. A column with no meaningful total shows a dash. In some grouped tables Polygon cannot work out Begin and End, because group rows have no order to pick a record by. The total then shows a dash; hover over it to read why.
¶ Add a headline card
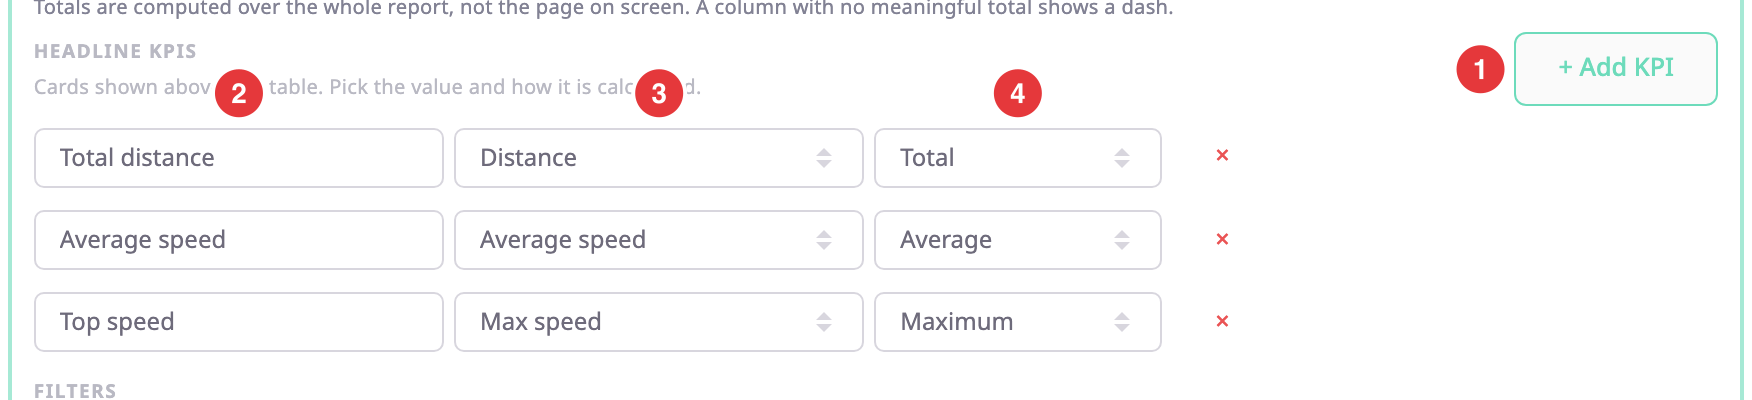
- Under Headline KPIs, select Add KPI, marked 1.
- Optional: In the label field, marked 2, enter the card's title, for example Top speed.
- In the column list, marked 3, choose the value.
- In the operation list, marked 4, choose how to work it out, for example Maximum.
A table can have 3 cards and a template 5. At the limit you cannot select Add KPI. Select × to remove a card. Without cards, the report shows automatic headline figures.
¶ Filter rows

- Under Filters, select Add filter, marked 4.
- In the first list, marked 1, choose the column.
- In the second list, marked 2, choose the condition, for example at least or is one of.
- In the value field, marked 3, enter or choose the value, for example 1 for at least 1 km.
For the full list of conditions, see the builder fields. The value field follows the column: a number, yes or no, a date, a list, or a picker for units, drivers and other records. is empty and is not empty need no value. Every condition must match for a row to stay. Select × to remove a filter.