In the template builder you design a report: its data, columns, grouping and charts. To open it, in Reports > Create Report select New template, or Edit in a template's card menu.
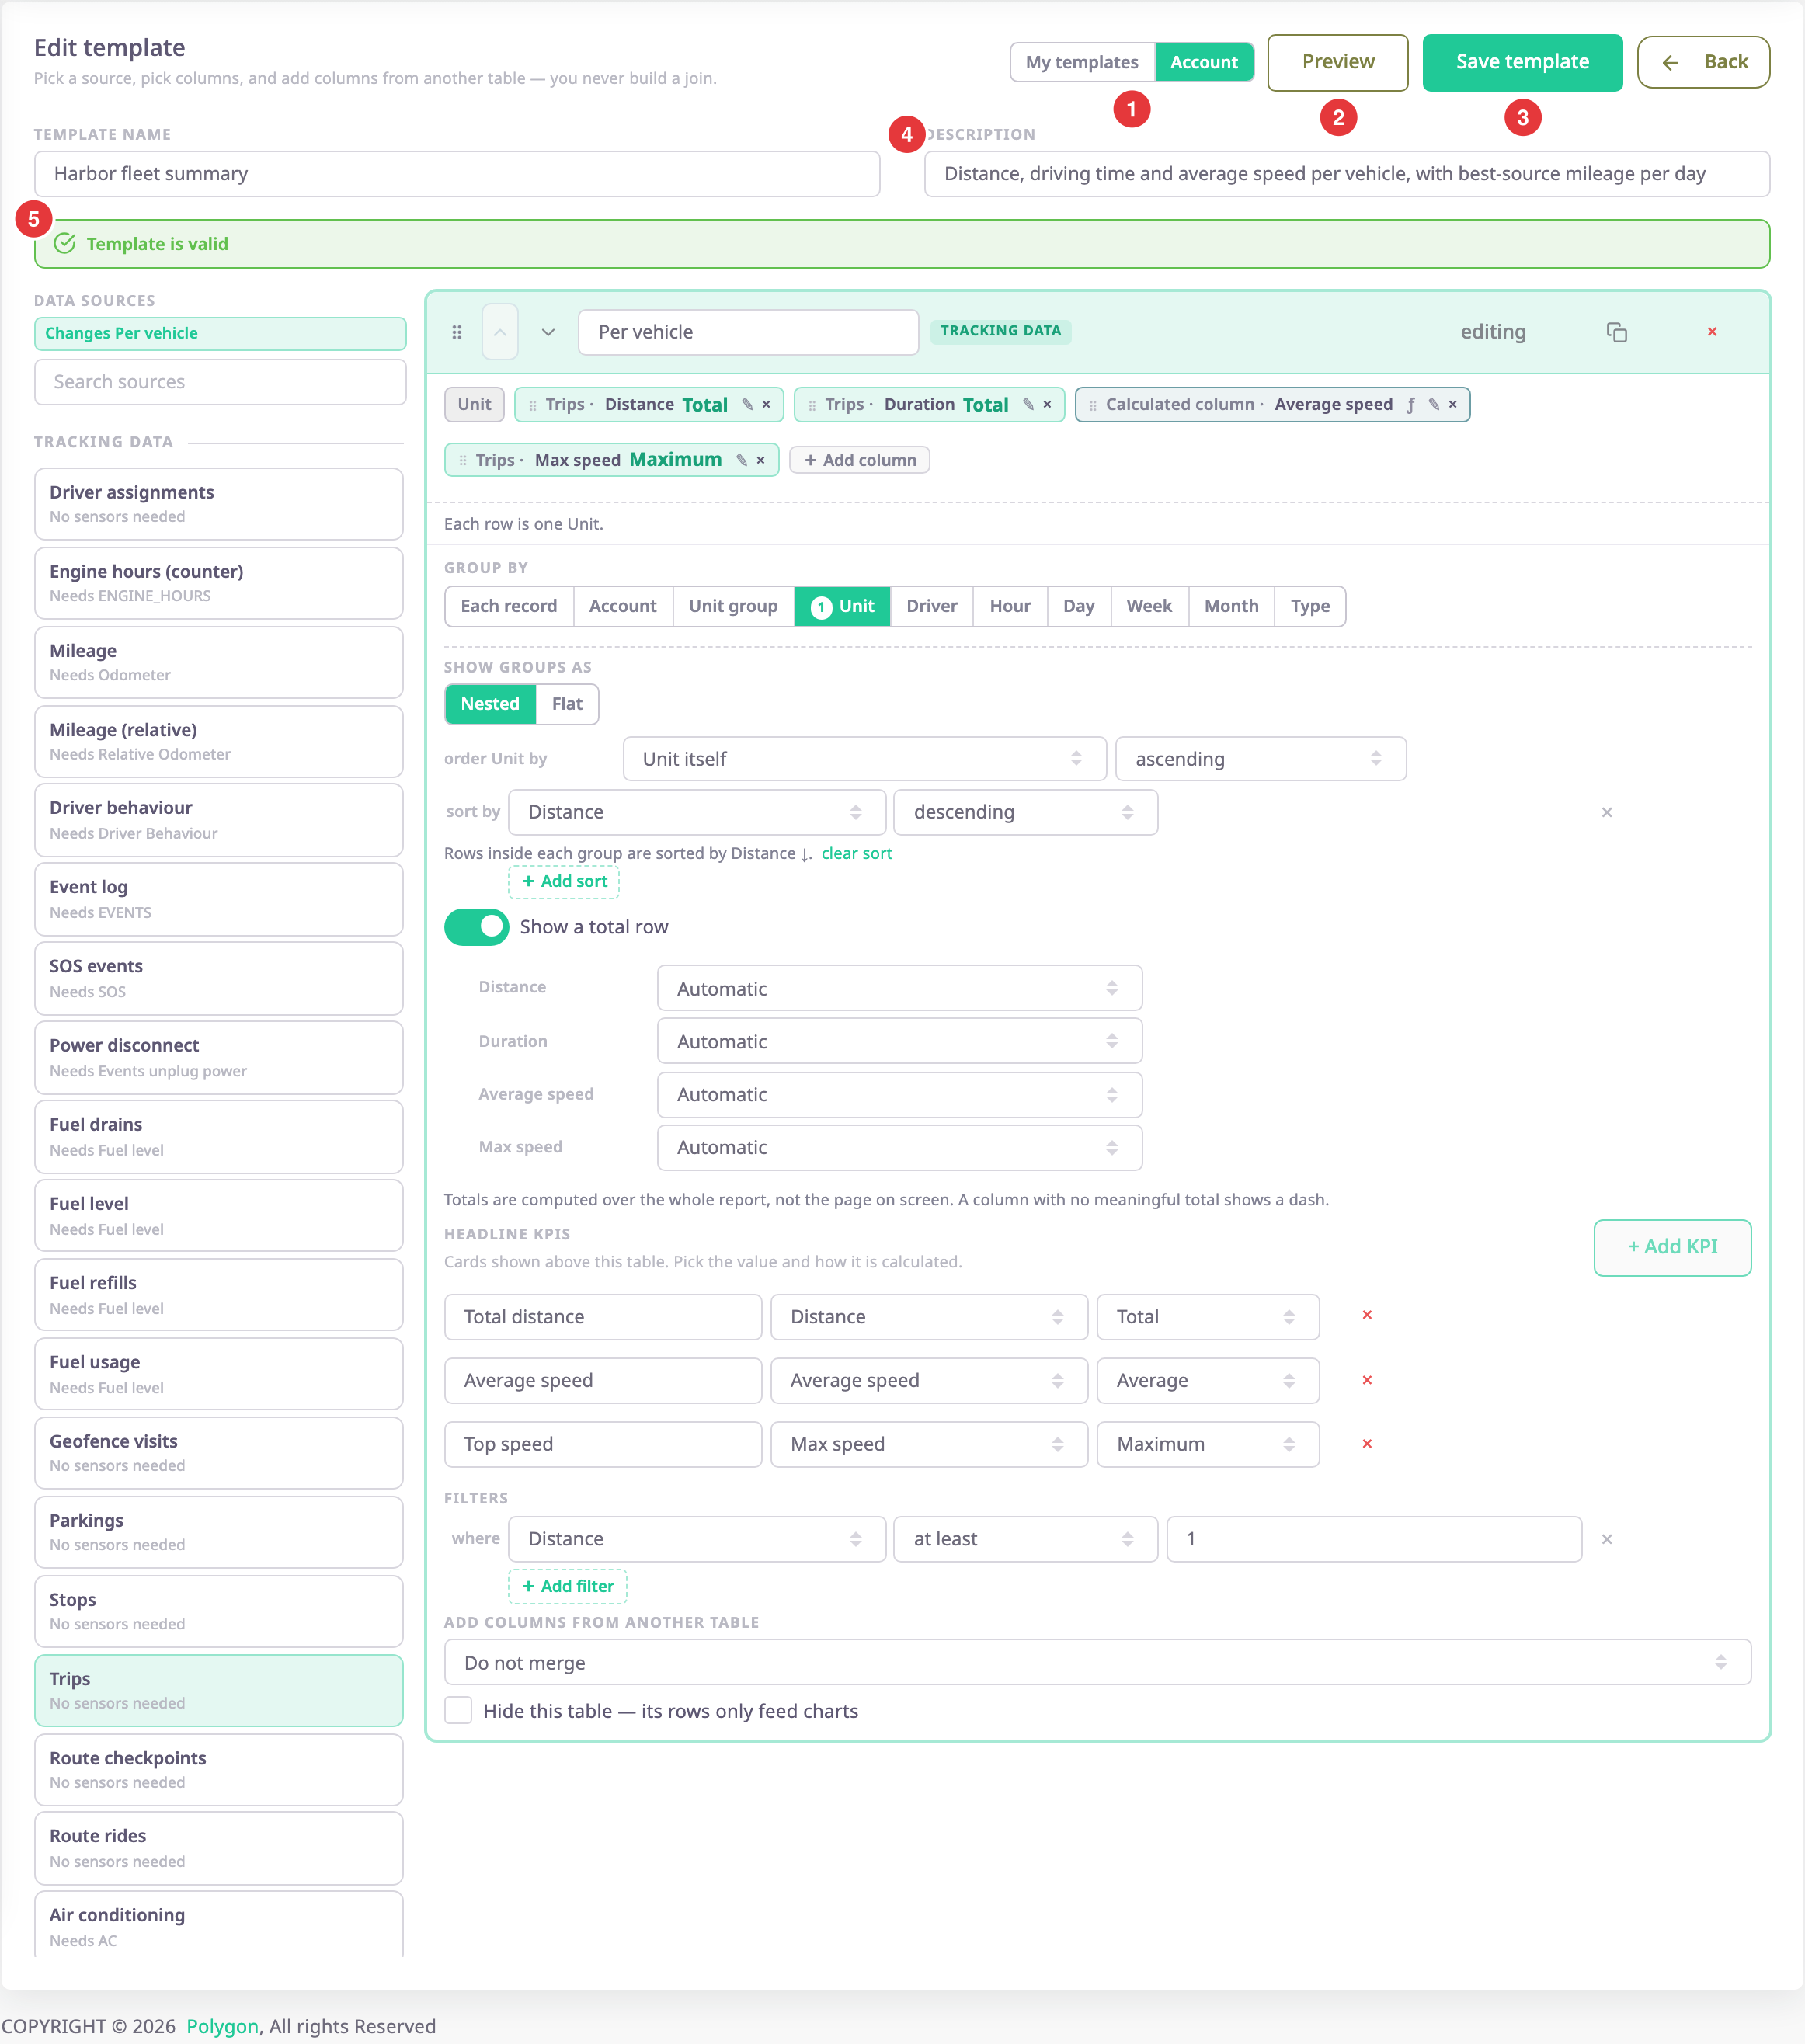
¶ Name, scope, preview and save
The header reads New template or Edit template.
| Control | What it does |
|---|---|
| Scope switch (1) | My templates keeps the template to yourself. Account shares it with everyone in your account. Only a user with the Owner role can choose Account. |
| Preview (2) | Opens the Generate screen with the template as it is now, without saving. Back to editor returns with your changes intact. |
| Save template (3) | Saves and returns to the library. Disabled until the template has a name and every table has a source. |
| Back | Returns to the library. With unsaved changes, a dialog asks first; Discard changes leaves without saving. |
Template name (4) and Description sit under the header. The validation bar (5) reads "Template is valid", or "This template cannot run yet — see below." with the problems listed under it.
¶ Data sources
The list on the left holds every source your role may read, grouped into Tracking data, Calculated, Fleet records and AI Assistant. The AI Assistant group holds AI usage, AI access & grants, AI credit top-ups and AI grant change history. It shows only if your role has Manage AI Assistant Settings. Under each name it says what a unit needs, for example "Needs Fuel level" or "No sensors needed". A source with ready-made charts also says how many, for example "3 ready charts". Add a chart lists them; see Report chart settings.

The line above the list, for example "Changes Per vehicle", names the table a source pick applies to. Selecting a source:
- creates the first table if there is none;
- replaces that table's columns with a default set for the source;
- clears its grouping, filters and matching.
Selecting a source the table already reads, such as one kind of a combined table, changes nothing.
Search sources filters the list.
¶ Combine kinds into one table
Some tracking sources are kinds of one family, such as Fuel drains and Fuel refills. One table can read several of them, so their rows sit in a single list.
Under the line above the source list, the open table shows a chip for each kind it reads. Combine with lists the other kinds of the same family that your role may read. Choosing one adds it to the table:
- The table keeps only the columns, filters and groupings that every kind records. A warning lists what it removed and ends with "not recorded for every kind in this table".
- An ungrouped table gets a column that names each row's kind.
- Add column offers only the columns every kind records.
- In the source list, every kind of the table is highlighted.
To stop reading a kind, select × on its chip. With one kind left, the table is an ordinary table again. The run page names a combined table after all its kinds, for example "Fuel drains + Fuel refills".
¶ Tables and columns
Each table is a block. Its header holds a drag handle and arrows to reorder it, the table name and a tag for its kind of data. Then come Edit ("editing" on the open table), a copy icon that duplicates the table and × to remove it.
The columns are chips. On each chip:
- The source name before the dot shows where the column comes from.
- In a grouped table, a word such as Total or Maximum says how the column folds together. Select it to change it.
- ✎ renames the column. Every language shows the new name.
- ƒ marks a calculated column and ⋔ a best-available column. Select them to edit.
- × removes the column. Drag a chip to move it.
Add column opens a menu of every column you can add:
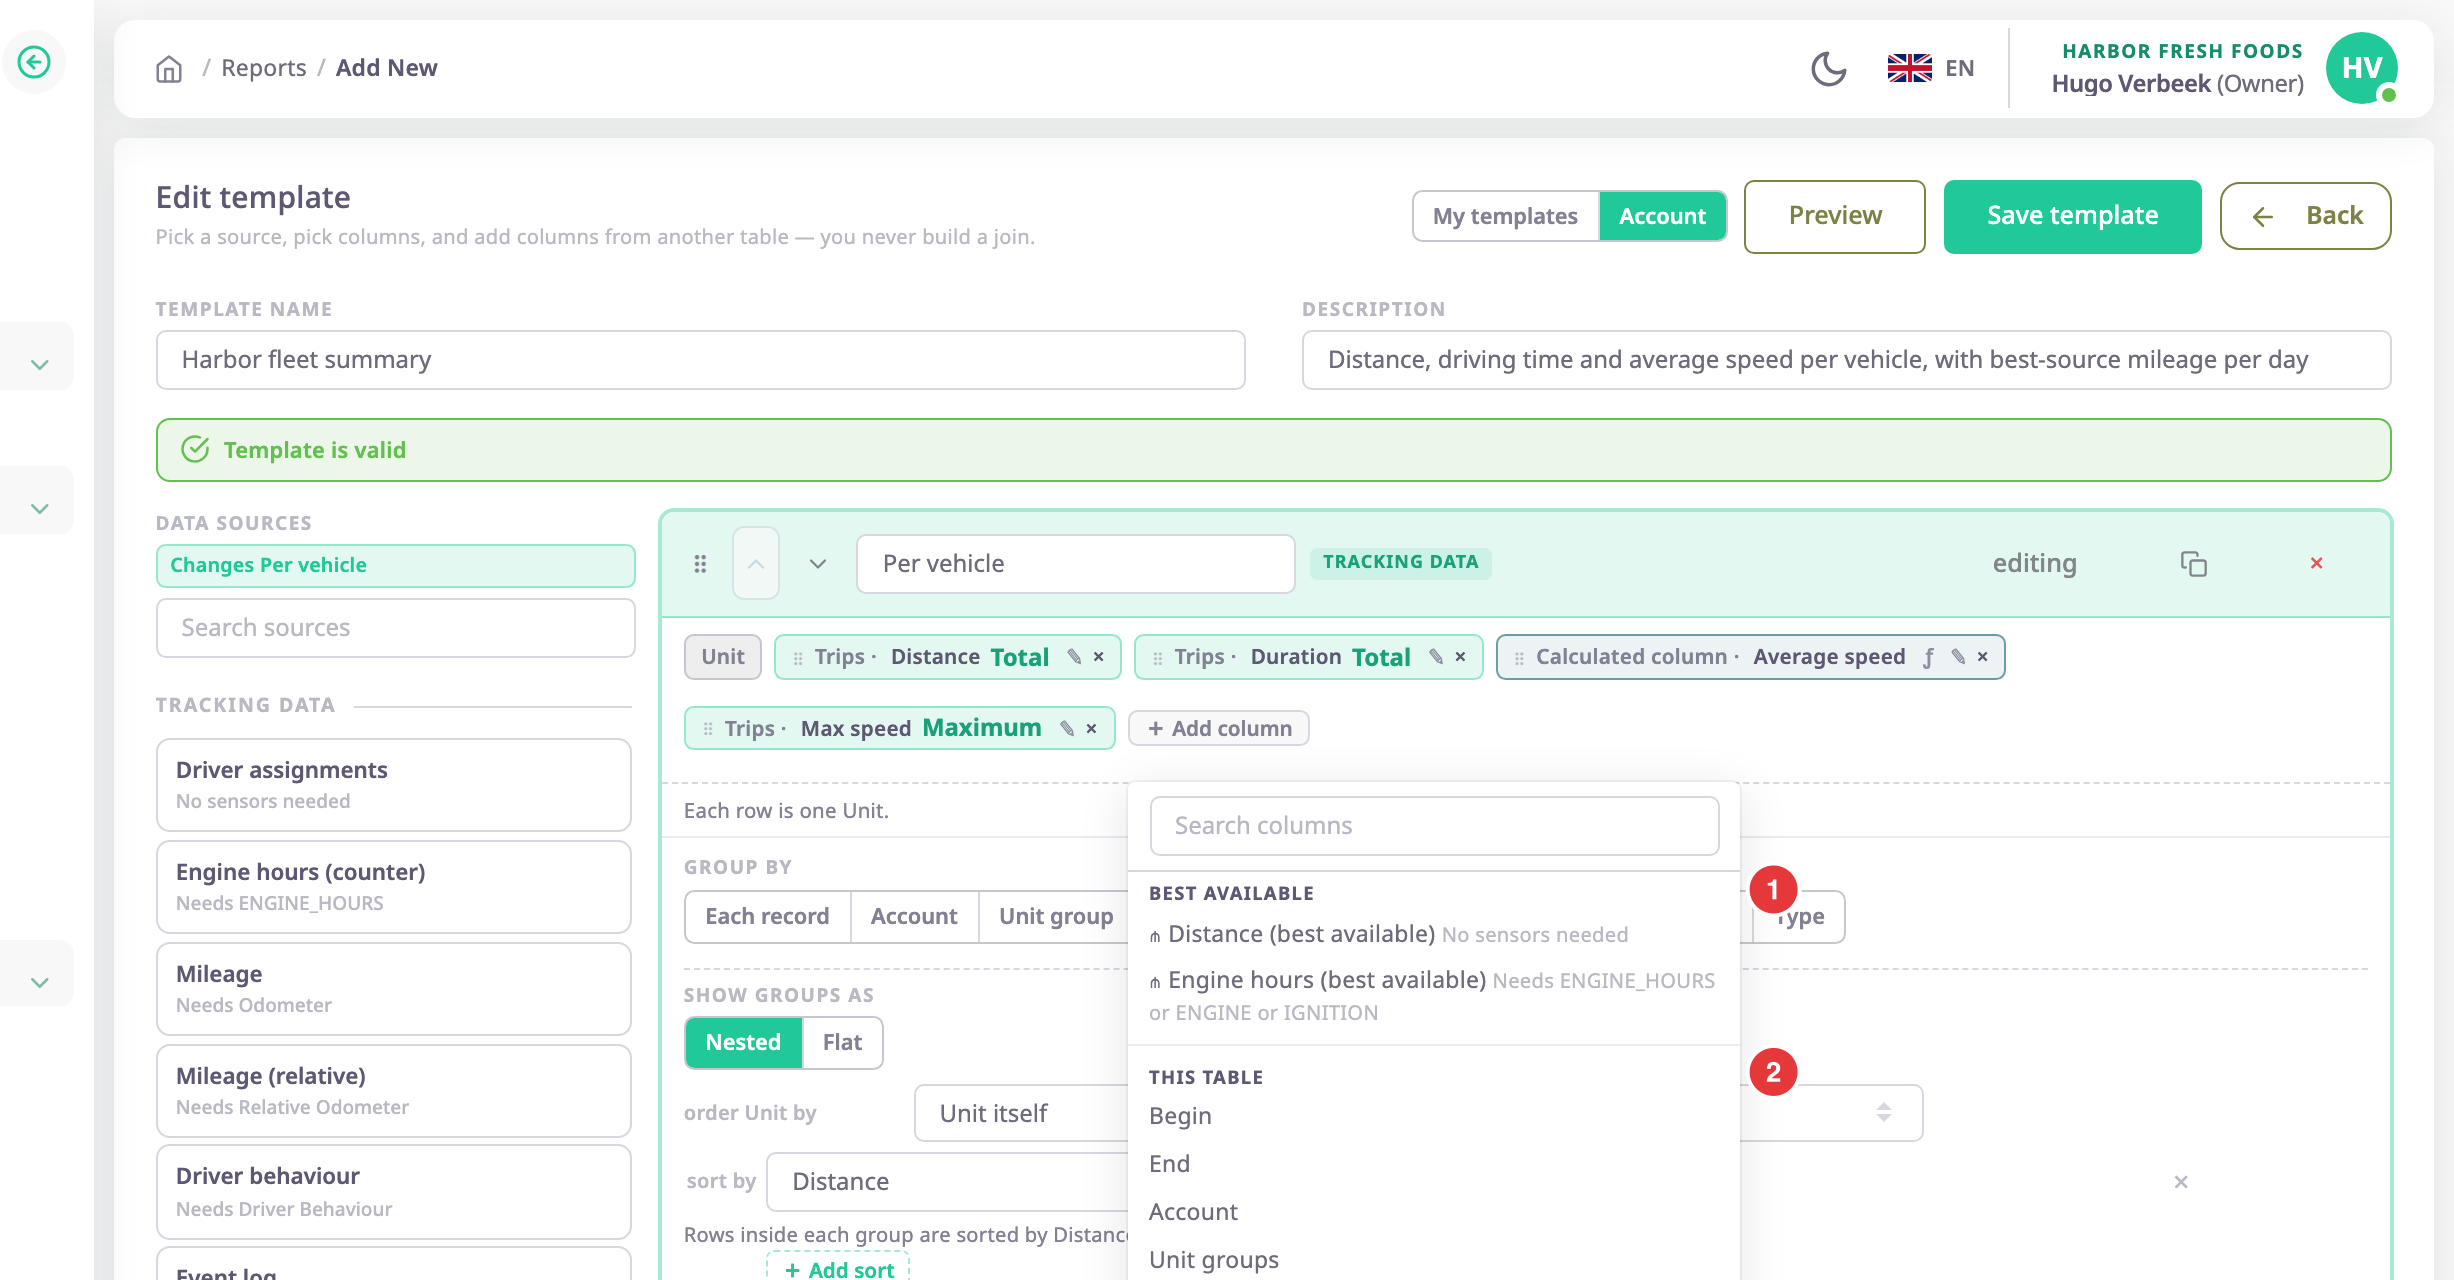
- Best available (1): columns that read each unit from the best source it has.
- This table (2): the columns of the table's own source.
- "From source" headings: columns of other sources. Adding one matches the two tables. See Add columns from another table.
- Calculated column and Conditional column at the bottom. See Add calculated and best-available columns.
Under the chips, a sentence such as "Each row is one Unit." says what one row means.
¶ Group by, sort, totals, KPIs and filters
The open table shows its settings in this order. For details, see Group, filter and total report rows.
| Setting | What it does |
|---|---|
| Group by | Folds records into one row per unit, driver, day or other key. Each record keeps every record. |
| Show groups as | Nested or Flat, and the order of each group level. |
| Add sort | Orders the rows. In a grouped table, the order applies inside each group. |
| Show a total row | Adds a total row worked out over the whole report, with a setting per column. |
| Headline KPIs | Cards above the table. Add KPI adds one: up to 3 per table and 5 per template. |
| Filters | Keeps only rows that match. Add filter adds a condition. |
| Use whole billing months (UTC) instead of the exact report period | Shown for sources that support it, such as AI usage and AI credit top-ups. Reads whole billing months, so a monthly figure equals what the AI credit meter counted. |
| Add columns from another table | Borrows the columns of another table in the template. |
| Hide this table — its rows only feed charts | Leaves the table out of the report and exports, but charts still use it. |
¶ Matching tables
When you add a column from another source, or choose a table in Add columns from another table, the dialog How should these rows match? opens.
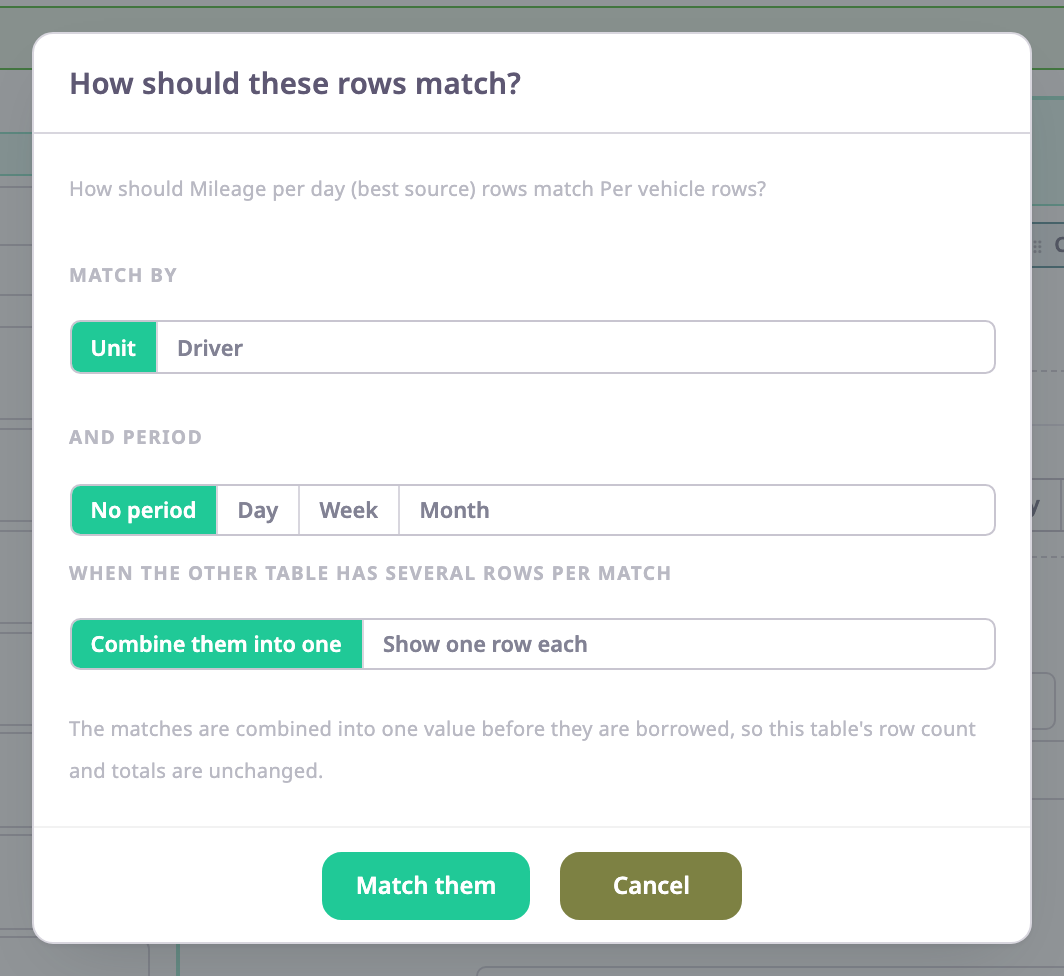
| Field | What it does | Allowed values |
|---|---|---|
| Match by | The key both tables share. | Unit, Driver. When both tables read AI Assistant sources, Account only. |
| And period | Also matches by period, for figures that make sense only day by day. | No period, Day, Week, Month |
| When the other table has several rows per match | What happens to extra matches. | Combine them into one keeps this table's rows and totals unchanged. Show one row each repeats this table's row once per match, with its own figures on the first only. |
Match them applies the match. A matched table then shows a link icon line with change matching.
¶ Fields
| Field | Required | What it does | Allowed values / example | Notes |
|---|---|---|---|---|
| Scope | Yes | Decides who sees the template. | My templates or Account | Account needs the Owner role. |
| Template name | Yes | Names the template in the library, reports, exports and schedules. | 1-120 characters. Example: Harbor fleet summary | — |
| Description | No | The line under the name on the card. | Up to 255 characters. | — |
| Data sources | Yes | The source a table reads. | Sources your role may read. | Changing it resets the table's columns, grouping, filters and matching. |
| Combine with | No | Adds another kind of the same family to the table. | Kinds of the table's family that your role may read. | Removes the columns, filters and groupings that not every kind records. |
| Table name | No | The table's title in the report and its sheet name in Excel. | Free text. Empty shows "Table 1" and so on. | — |
| Add column | Yes | The columns of the table. | Columns of any source, best-available, calculated and conditional columns. | At least one column. |
| Group by | No | Folds records into rows. | Each record, or keys such as Unit, Driver, Day, Week, Month. | Several keys nest; the number on a key is its level. |
| Add sort | No | Orders the rows. | Any column, ascending or descending. | — |
| Show a total row | No | Adds a total row. | On or off; per column Automatic, Total, Average, Minimum, Maximum, Count, Begin, End or No total. | Off on a new table. |
| Headline KPIs | No | Adds cards above the table. | Column and operation. | Up to 3 per table, 5 per template. |
| Filters | No | Keeps matching records only. | Column, operator and value. | Operators include is, is not, more than, at least, less than, at most, is one of, is none of, is empty and is not empty. |
| Add columns from another table | No | Borrows columns from another table. | Do not merge, or a table of the template. | Opens the match dialog. |
| Use whole billing months (UTC) instead of the exact report period | No | Reads whole billing months instead of the report's exact period. | On or off. | Only on sources that support it. Off by default. |
| Hide this table — its rows only feed charts | No | Hides the table. | On or off. | Off by default. |
Add a chart opens a list of ready-made charts, starting with the ones for the sources your template reads, and ends with Blank chart. For the list and the chart fields, see Report chart settings.
¶ Permissions
- The builder needs the Add template action of Reports; saving changes to an existing template needs Update template.
- You can use only the data sources your role has a permission for.
- Only a user with the Owner role can save a template at Account scope or change an account template. The service refuses anyone else.