A chart shows at a glance when a value changed: a fuel drop at night, a temperature rising in a reefer, a battery running down. You draw it on the Messages screen.
¶ Before you start
- You need Units with Read and Show Messages, and Devices with Read. The Owner role has them.
¶ Open the Chart tab
-
In the side menu, select Units > Messages.
-
Choose the Unit and the Time Range.
-
In Message Type, choose Sensor to chart the unit's sensors by name. Raw charts the device's parameters.
-
Select Execute.
-
Select the Chart tab, marked 5.
The chart and the Line selector appear.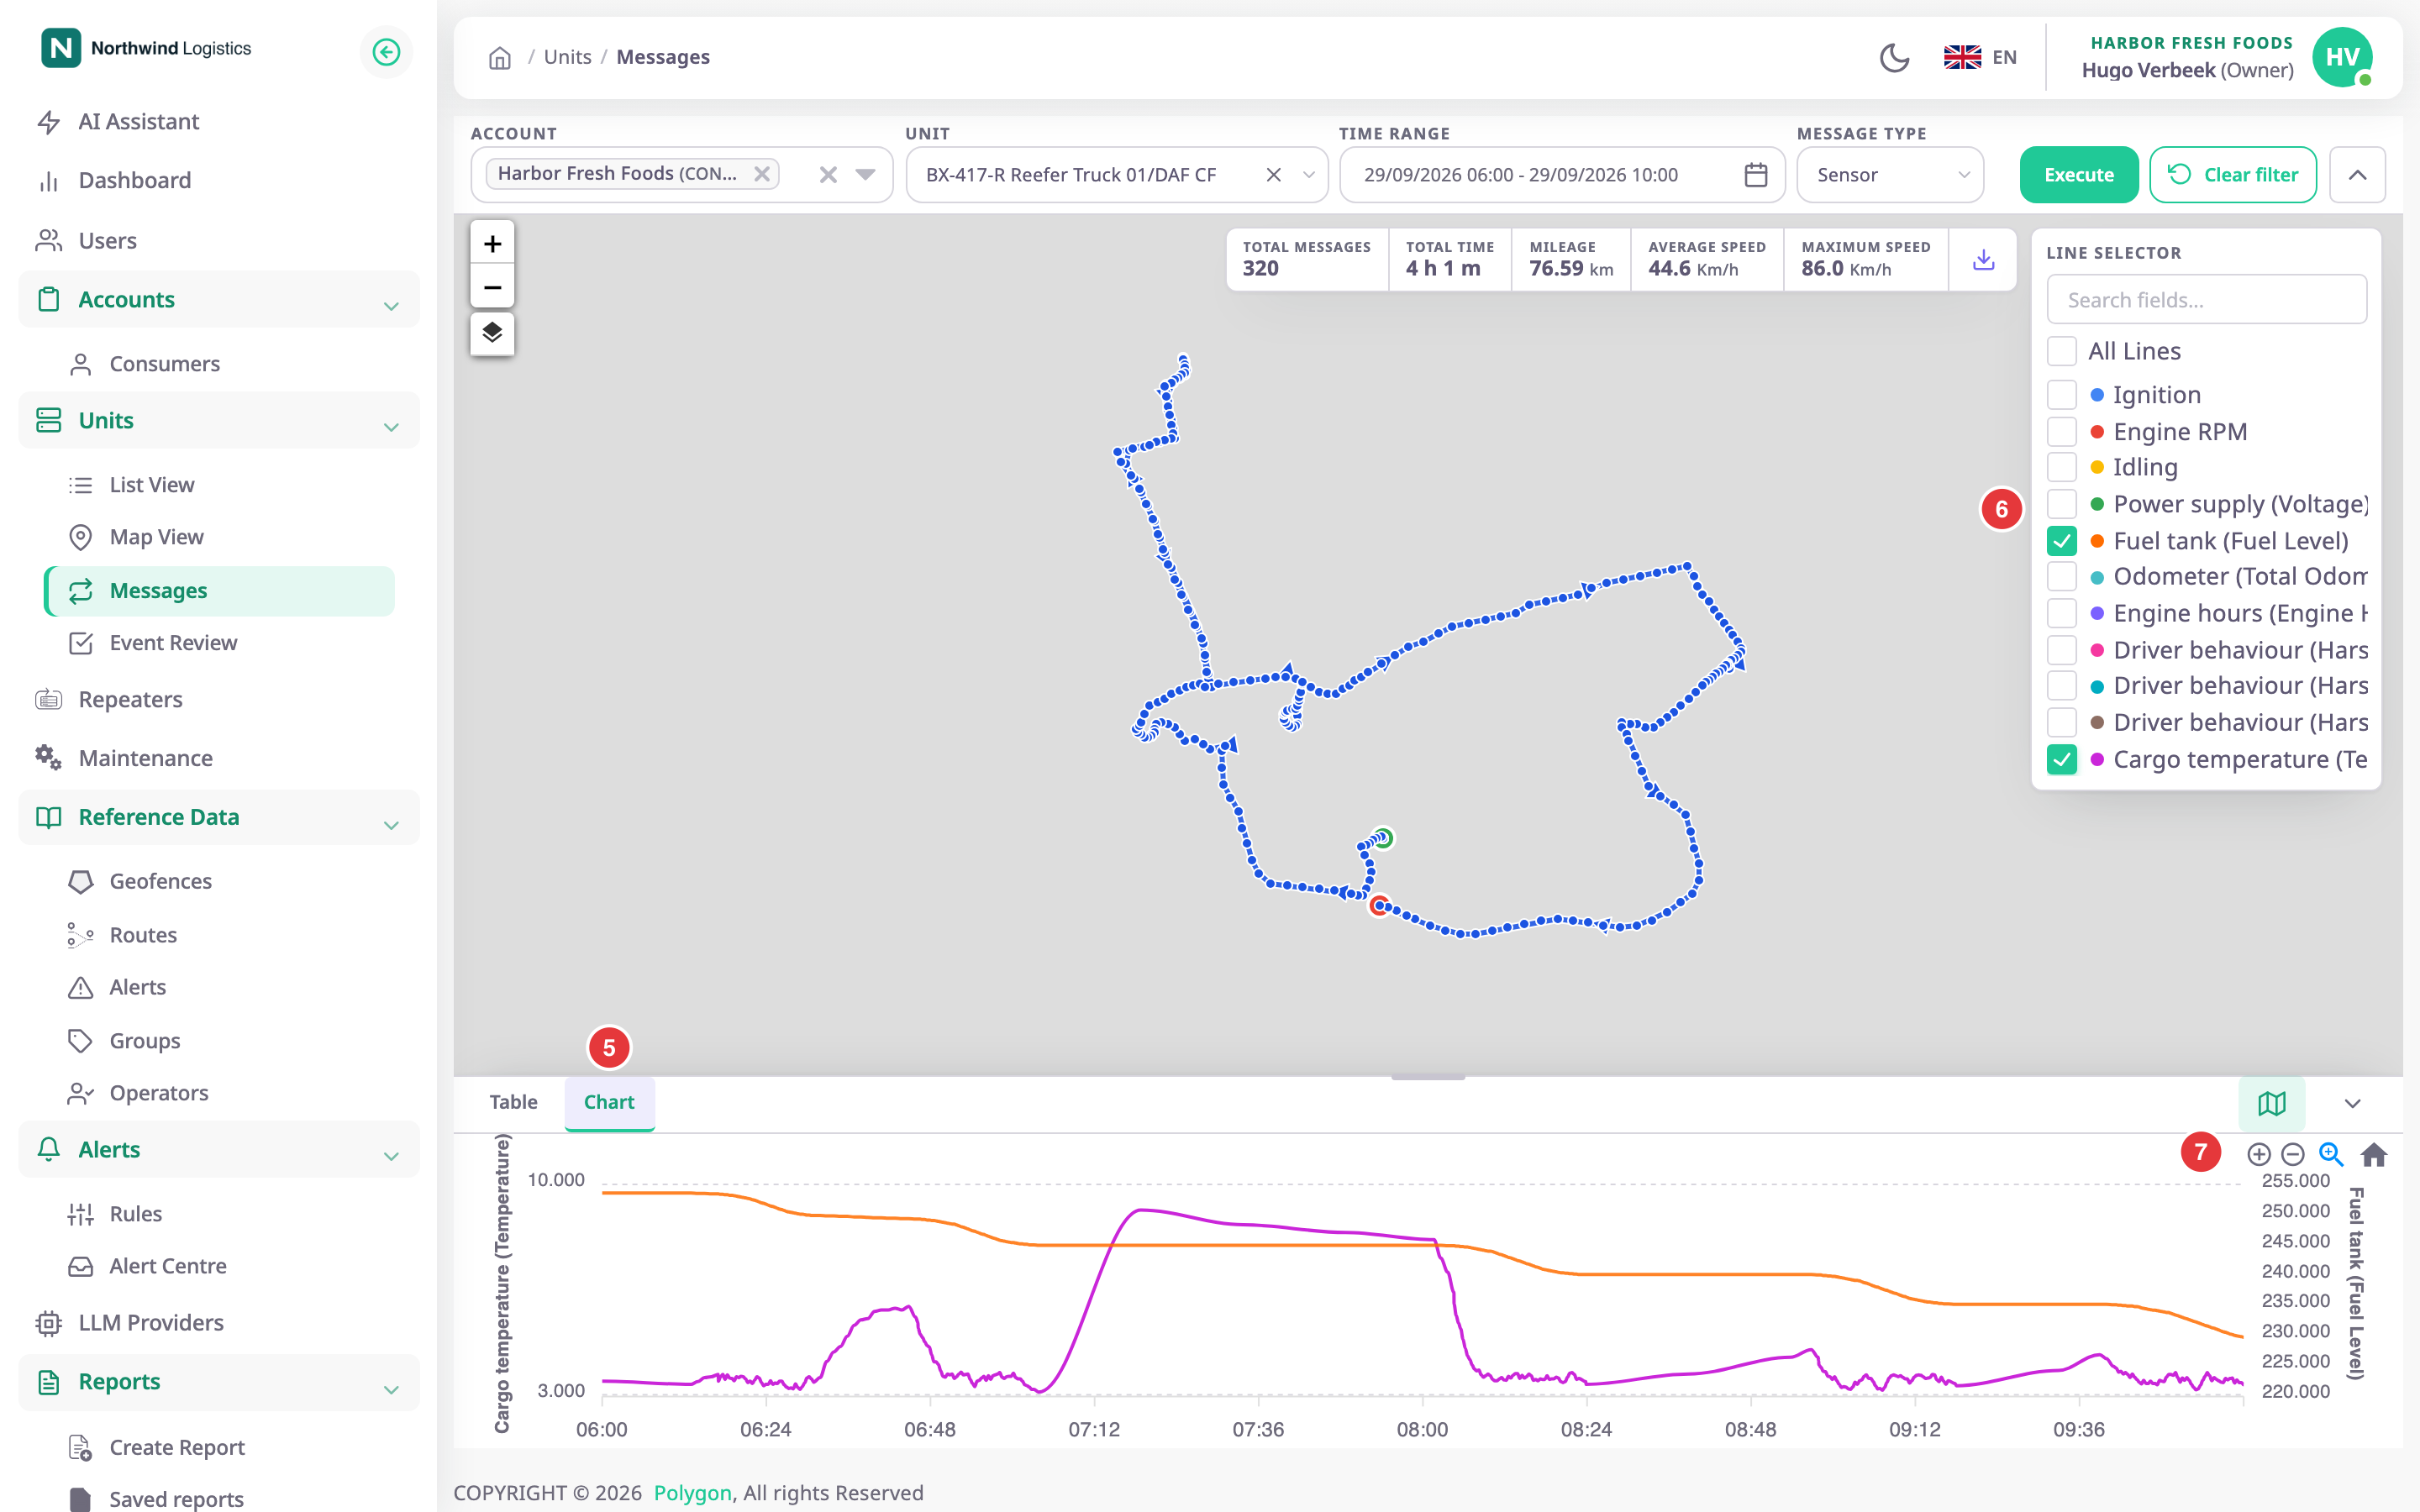
¶ Choose the lines
- In Line selector, marked 6, select the values to draw, for example Fuel tank and Cargo temperature.
The chart redraws.
To find a value in a long list, enter part of its name in Search fields.... All Lines draws every value. The first two lines get their own scales on the left and right.
¶ Zoom and reset
- With the tools, marked 7, select the zoom tool, then drag across the part of the chart you want.
The chart shows that part only.
Select the home icon to show the whole period again. The smallest window is 10 minutes.
¶ Match a point to the table and map
Double-click the chart at the moment you want. The map drops a red pin on the nearest position. If that message is on the current page of the Table tab, the row is highlighted there too.