The Alert Centre shows what needs attention now and what happened before: every incident your alert rules opened. It updates live. To open it, in the side menu, select Alerts > Alert Centre.
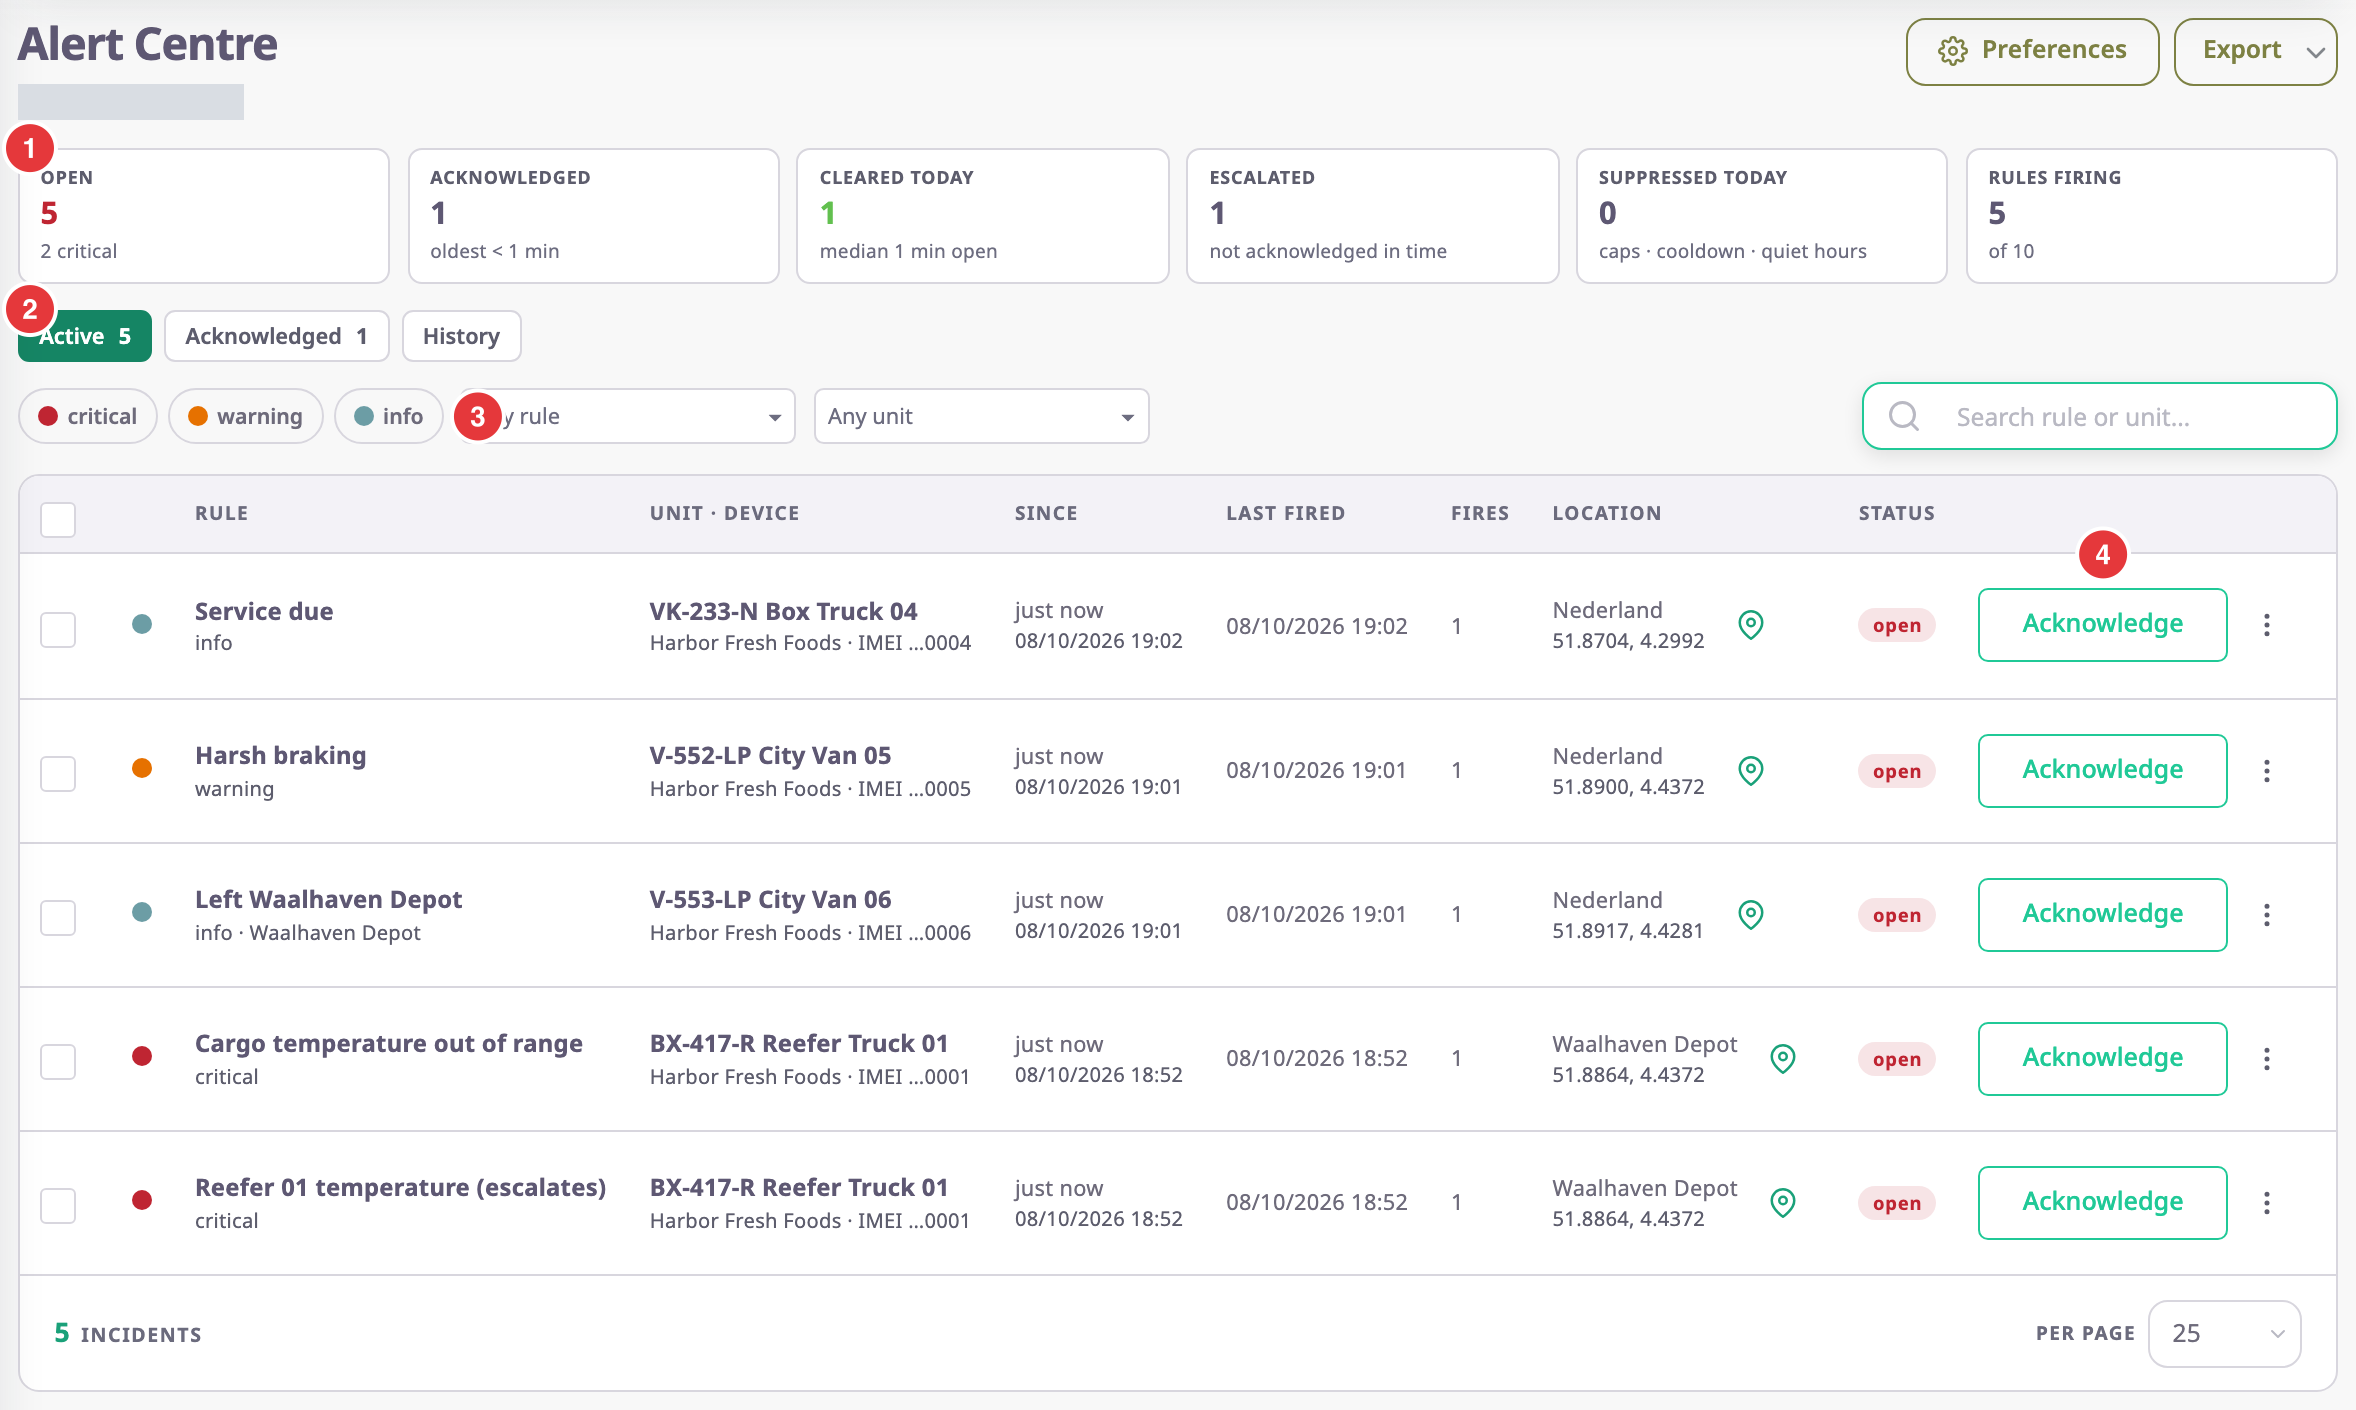
Under the title, "live" with a green dot means new incidents arrive on their own. "not live · reload to refresh" means the live connection dropped; reload the page.
¶ Counters
The six counters, marked 1, cover the account you are looking at, whatever tab or filter you choose.
| Counter | What it counts |
|---|---|
| Open | Incidents open now. The line below counts the critical ones. |
| Acknowledged | Incidents someone acknowledged that have not cleared yet, and the age of the oldest. |
| Cleared today | Incidents that cleared today, and how long they were open in the middle case (the median). |
| Escalated | Incidents that reached an escalation step because nobody acknowledged them in time. |
| Suppressed today | Fires today that sent nothing, by reason: caps, cooldown, quiet hours and others. |
| Rules firing | Rules with an open incident now, out of your enabled rules. |
¶ Active, acknowledged and history tabs
The tabs, marked 2, show the counts of the first two.
| Tab | What it lists |
|---|---|
| Active | Open incidents, including suppressed ones. This is the default. |
| Acknowledged | Incidents someone acknowledged that are waiting to clear. |
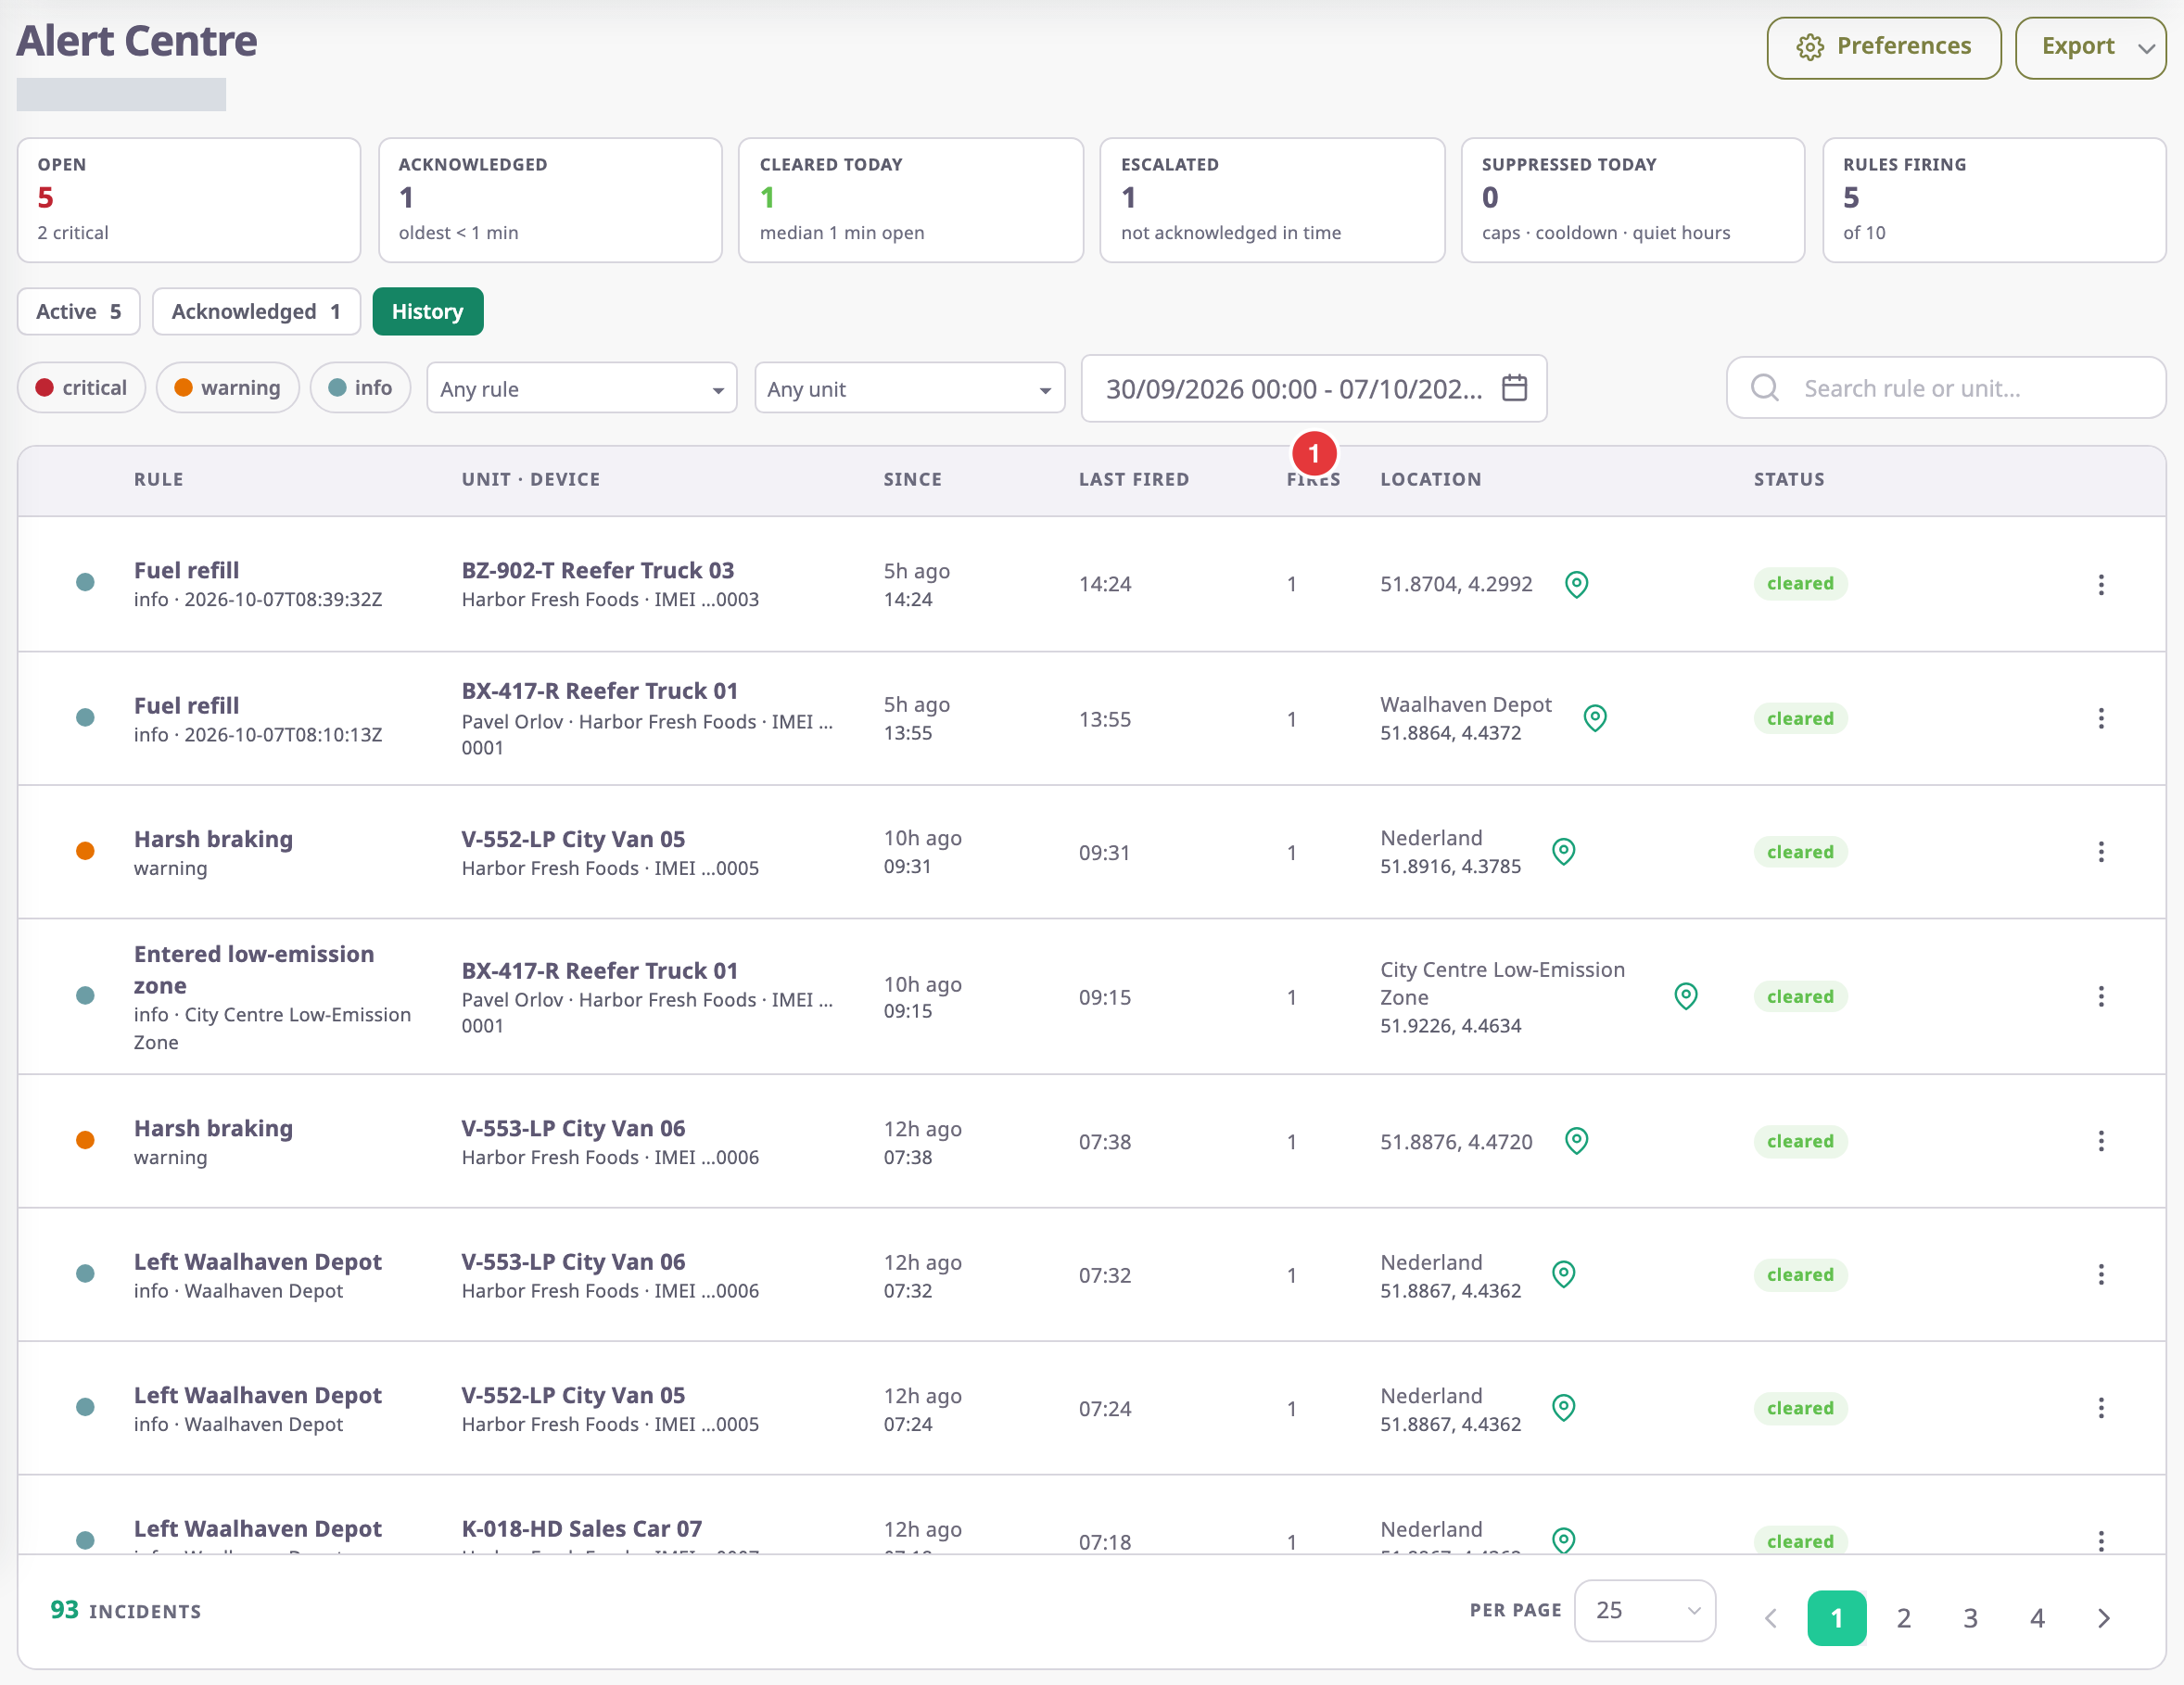
| History | Every incident that opened in a period, in any status. |
History adds a period, marked 1 below. It starts at the beginning of the day seven days ago and ends now.
¶ Filters
| Filter | What it does | Notes |
|---|---|---|
| Account | Shows the incidents of the account you choose. | Only if your role can manage sub-account rules and your account has sub-accounts. |
| Inherited | Also shows incidents on units in sub-accounts. | Shown with the account filter. On by default. |
| critical, warning, info, marked 3 | Shows only incidents of the severities you select. Select again to clear. | None selected means all. |
| Any rule | Shows only incidents of the rules you choose. | Several allowed. |
| Any unit | Shows only incidents on the units you choose. | Several allowed. |
| Search | Finds incidents by rule or unit name. | — |
The app keeps the tab and filters in the address, so a bookmark opens the same view.
¶ Columns
| Column | What it shows |
|---|---|
| Checkbox | Selects the incident for a batch action or an export. Only open, suppressed and acknowledged incidents have one, and only if you can acknowledge incidents. |
| Dot | The severity: red critical, orange warning, blue-grey info. |
| Rule | The rule name and severity. Fuel templates also show the detector's confidence and a Suspected tag. |
| Unit · device | The unit, then the driver, the account and the last four digits of the device's IMEI. |
| Since | How long ago the incident opened, and when. |
| Last fired | When the rule last fired for this incident. |
| Fires | How many times the rule fired for this incident, including repeats. |
| Location | The address where it fired, or the coordinates. The pin opens the unit on the map at that time; see below. |
| Status | open, suppressed, acknowledged, cleared or resolved. |
Select a row to open the incident. On a wide screen it opens in a panel over the list; on a narrow one it opens as a page.
See Incident details.
The pin opens the unit's track from 10 minutes before the incident to 10 minutes after it closed. If your role cannot see unit history, it opens the unit on the live map instead.
¶ Row actions
| Action | What happens |
|---|---|
| Acknowledge | Marks the incident as yours. It moves to Acknowledged, and pending escalation steps stop. The message "“rule” acknowledged" confirms it. |
| Resolve | On an acknowledged incident: opens Resolve incident, where you add an optional comment and close it. |
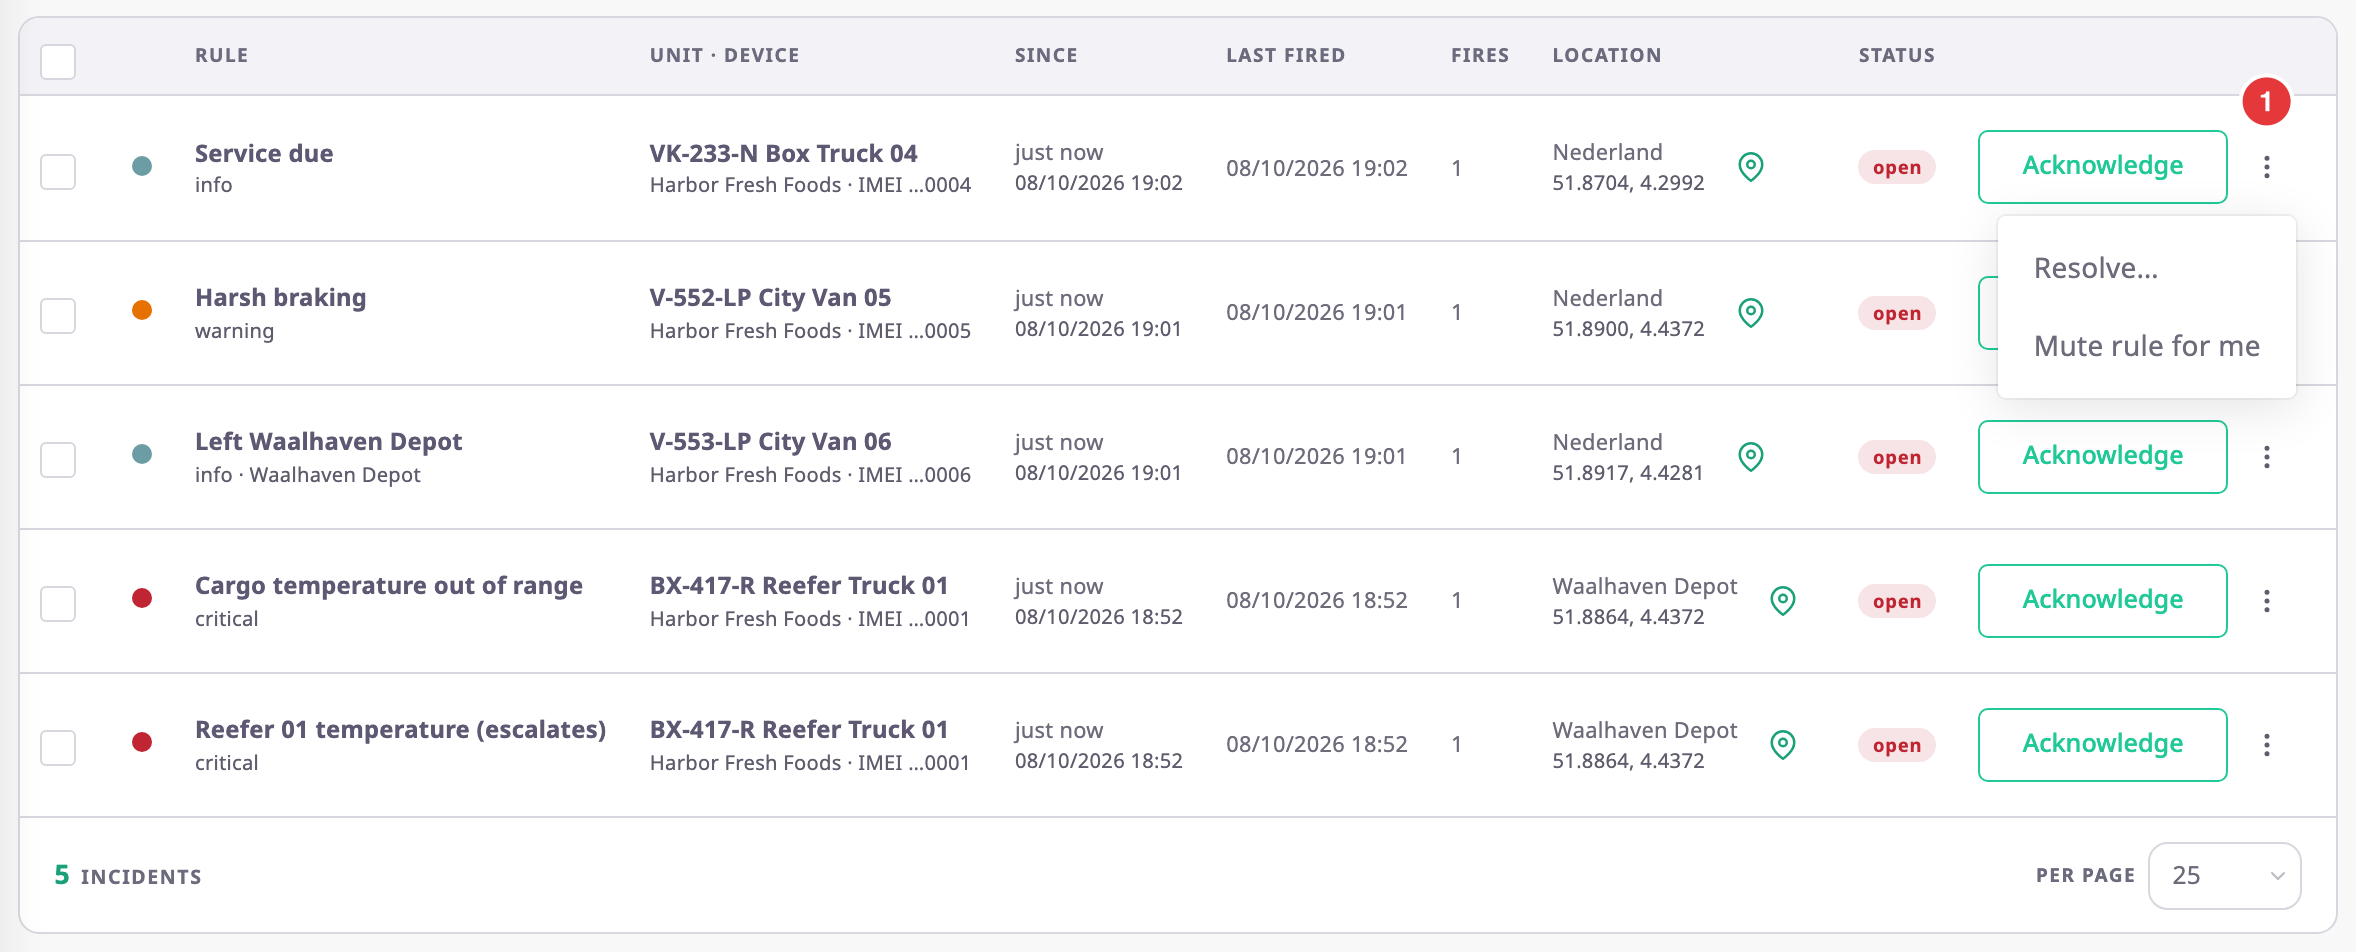
| More actions (⋮), marked 1 | Opens the row menu. |
| Resolve… | Opens Resolve incident for an open incident. |
| Mute rule for me | Stops this rule's notifications to you. Its incidents still show here. |
| Open rule | Opens the incident's rule in the rule form. Shown if you can edit rules. |
| Per page | Shows 10, 25 or 50 incidents per page. Default 25. |
¶ Batch actions
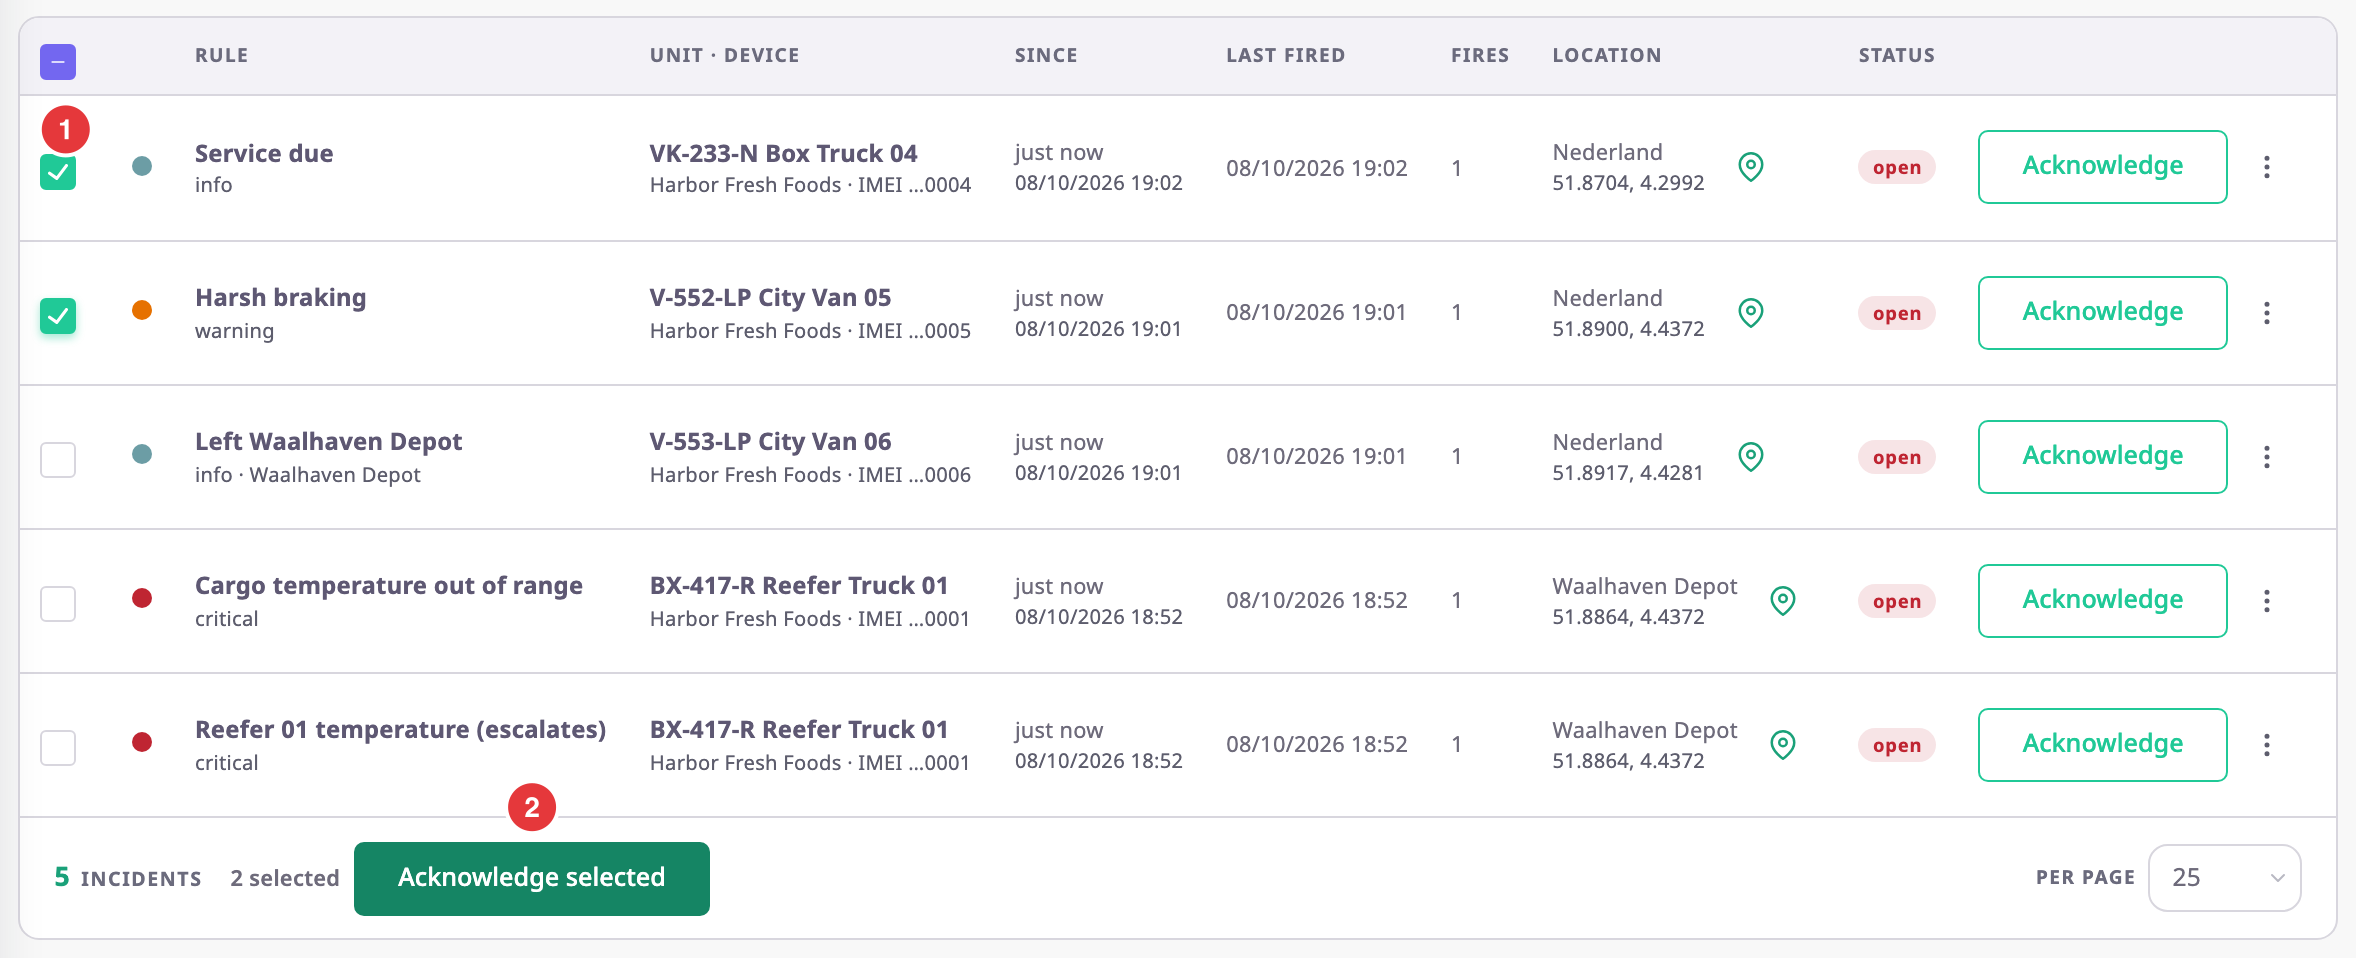
When you tick one or more incidents, a bar appears above the list. It counts the selected incidents and offers the actions that fit the tab.
| Control | What it does |
|---|---|
| Header checkbox | Selects every incident on this page that has a checkbox. |
| Select all {n} matching | Shown when the whole page is ticked and more incidents match. Selects every incident that matches the tab and filters, on every page. |
| Acknowledge | On Active only. Asks "Acknowledge n selected incidents?", then acknowledges them. |
| Resolve | On Active and Acknowledged. Asks "Resolve n selected incidents? No comment is recorded.", then resolves them. |
| Clear selection | Unticks everything. |
Your selection stays when you change page. Changing the tab, a filter, the search or the account clears it. The server limits how many items one batch can take; above the limit the bar says "Select up to n items. Narrow the filter." and the actions stay off.
After a batch, Result shows how many incidents succeeded and failed, with the reason for each failure. Select failed ticks the failed incidents so you can try again.
See Acknowledge and resolve incidents.
¶ Export

Export saves the incidents you ticked as a file. Tick the incidents first, or tick the page and select Select all {n} matching. Until you tick something, the menu shows "Select rows to export" and its items stay off.
| Option | What you get |
|---|---|
| Excel (.xlsx) | A spreadsheet with one row per incident. Up to 10,000 incidents. |
| Opens the browser's print dialog; choose Save as PDF there. Up to 2,000 incidents. |
The note at the foot of the menu says what the file holds, for example "The 12 selected records". The file has the columns Severity, Rule, Unit · device, Since, Last fired, Fires, Location and Status. Times are full dates and times, not "3 hours ago". The app names the file alert-incidents followed by the date and time.
Preferences, marked 1 above, opens your own alert preferences.
See Alert preferences.
¶ Permissions
The Owner role has all of these.
- To open the Alert Centre you need Alert Incidents with Read.
- Acknowledge, Resolve, the checkboxes, the batch actions and Export need Alert Incidents with Edit, because export works on ticked incidents.
- Mute rule for me needs Alert Preferences with Edit.
- Open rule needs Alert Rules with Edit.
- The account filter and Inherited need Alert Sub Account on Alert Rules.