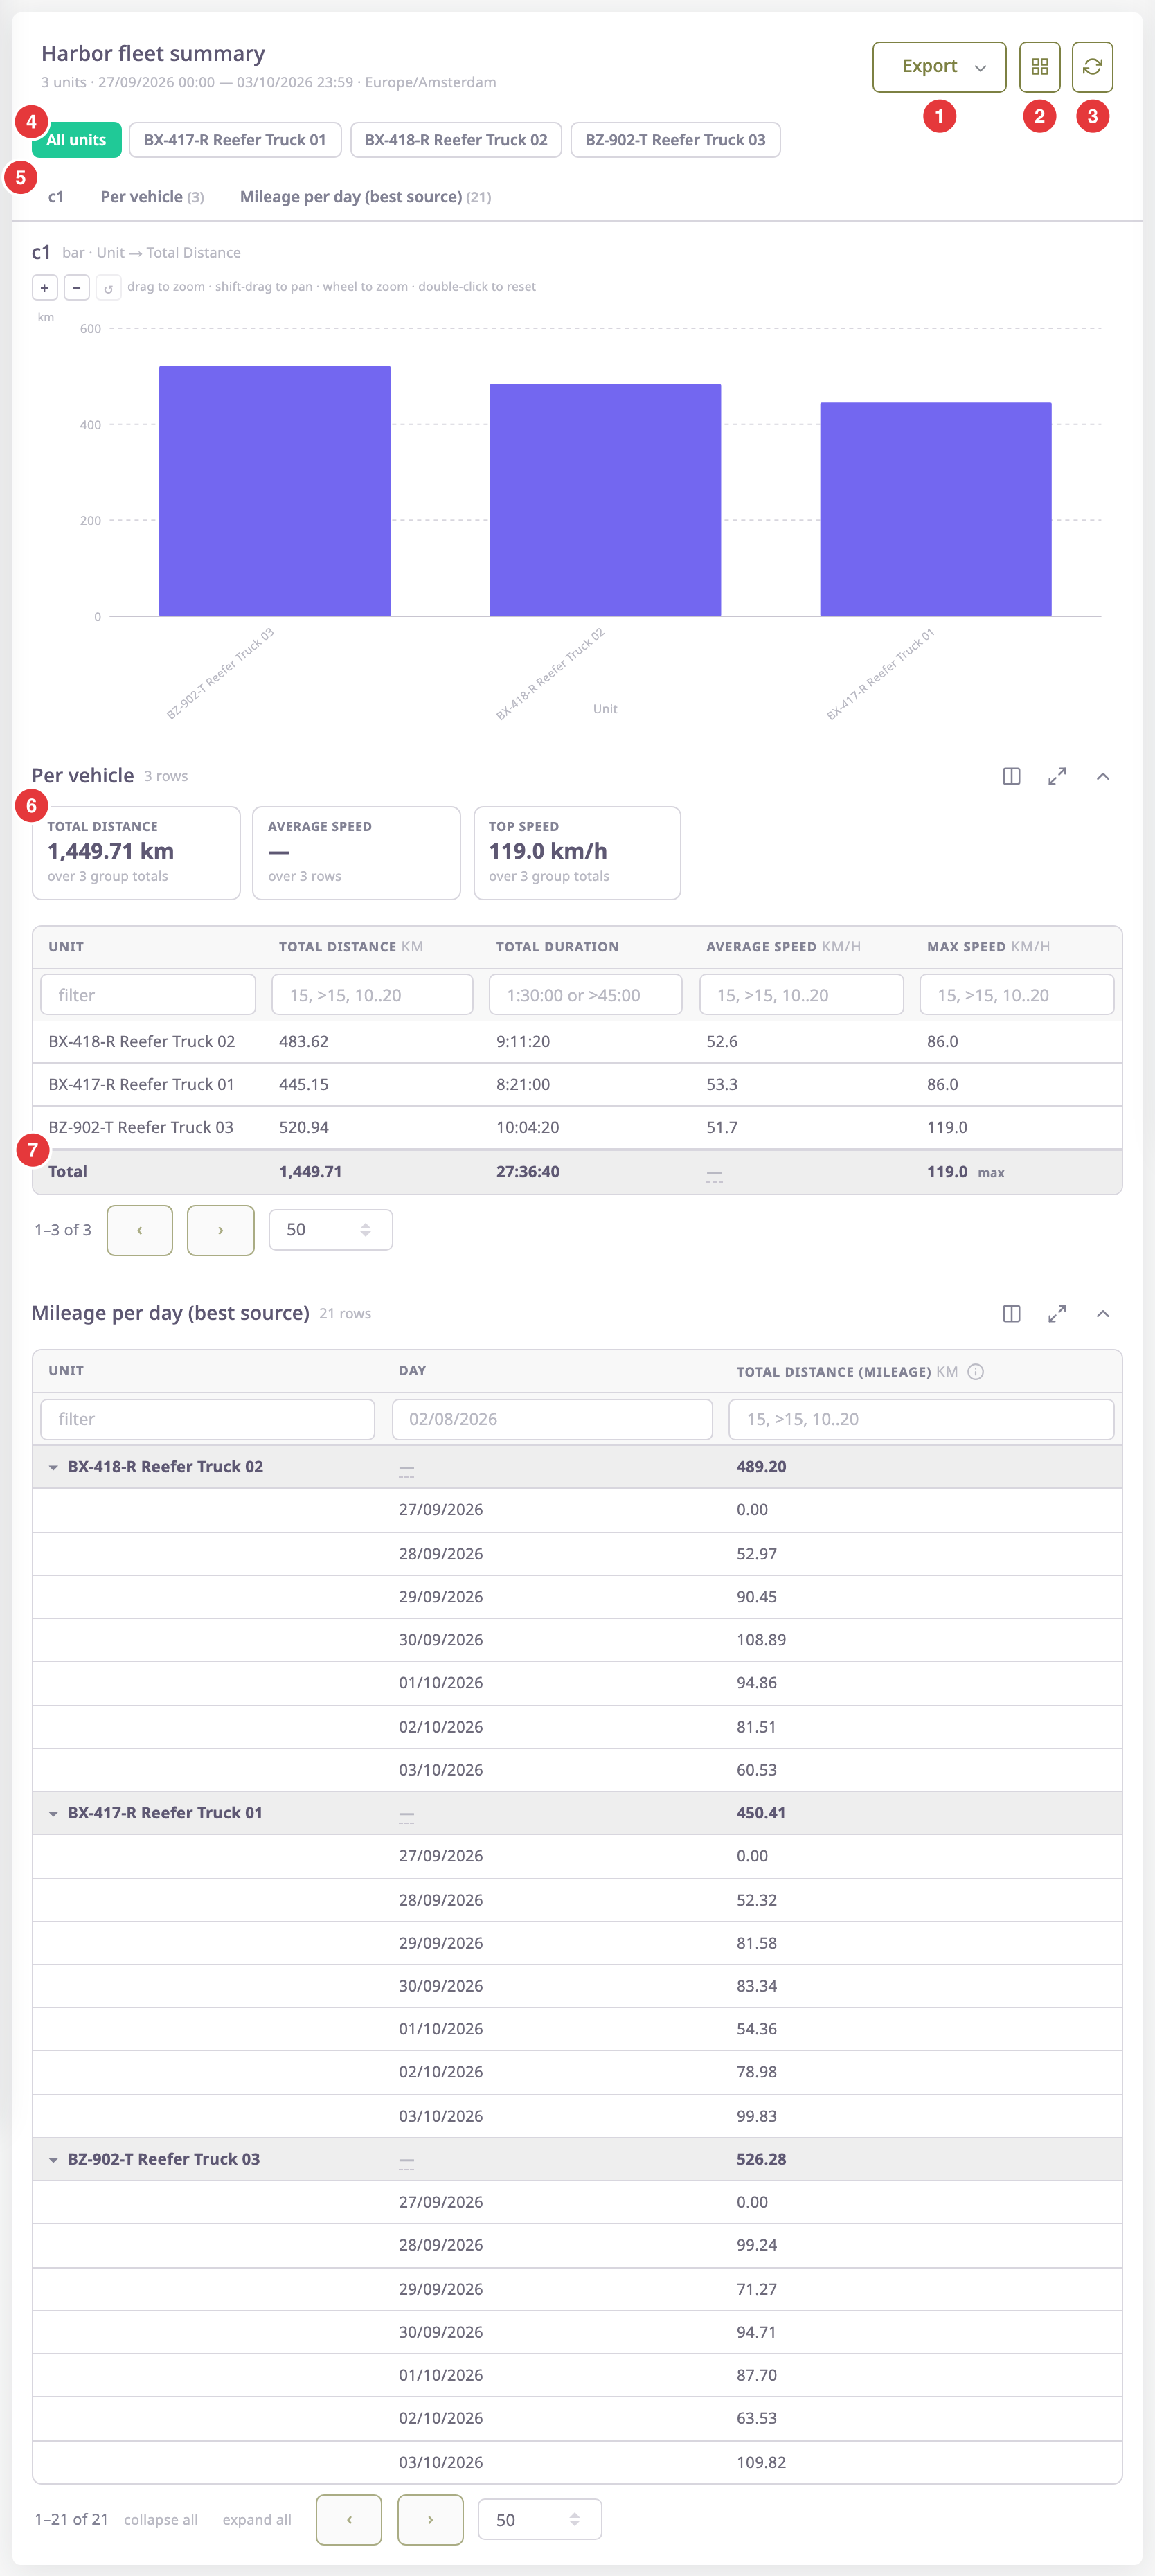
A finished report appears under the template header on the Generate screen, after you select Generate Report. It has a toolbar, KPI cards, charts and one block per table.
¶ Header and toolbar
Under the report name, one line states what it covers: the number of units, the period and the time zone.
| Control | What it does |
|---|---|
| Export (1) | Opens the export menu: Excel, PDF and one CSV per table. See Download a report as Excel, PDF or CSV. |
| Dashboard icon (2) | Pin to dashboard. Opens the dashboard with a widget form filled in from this report. Shown only for a saved template, not for a preview. See Pin a report to a dashboard. |
| Circular arrows (3) | Run this report again, with the same choices. |
When the server reports it, a tag next to Export says how long the run took. It reads "from cache" when the result came from a recent identical run.
Notices under the header tell you when some units cannot answer every column, or when the template hides a table that only feeds the charts. A notice also tells you when the stored figures were still changing.
¶ Unit filter and sections
- The unit pills (4) appear when the report covers more than one unit. All units shows everyone; a unit pill narrows every table and chart to that unit. A "+N more" link shows the rest.
- The section links (5) jump to each chart and table. A table link shows its row count, for example "Per vehicle (3)".
¶ Headline cards
Cards (6) above a table show headline figures for the whole report, for example the total distance or the top speed. The line under each figure says what Polygon worked it out over, for example "over 3 group totals". The template decides which cards appear; without any, the report shows its own automatic figures.
¶ Charts
Each chart has a title and a short description of what it plots.
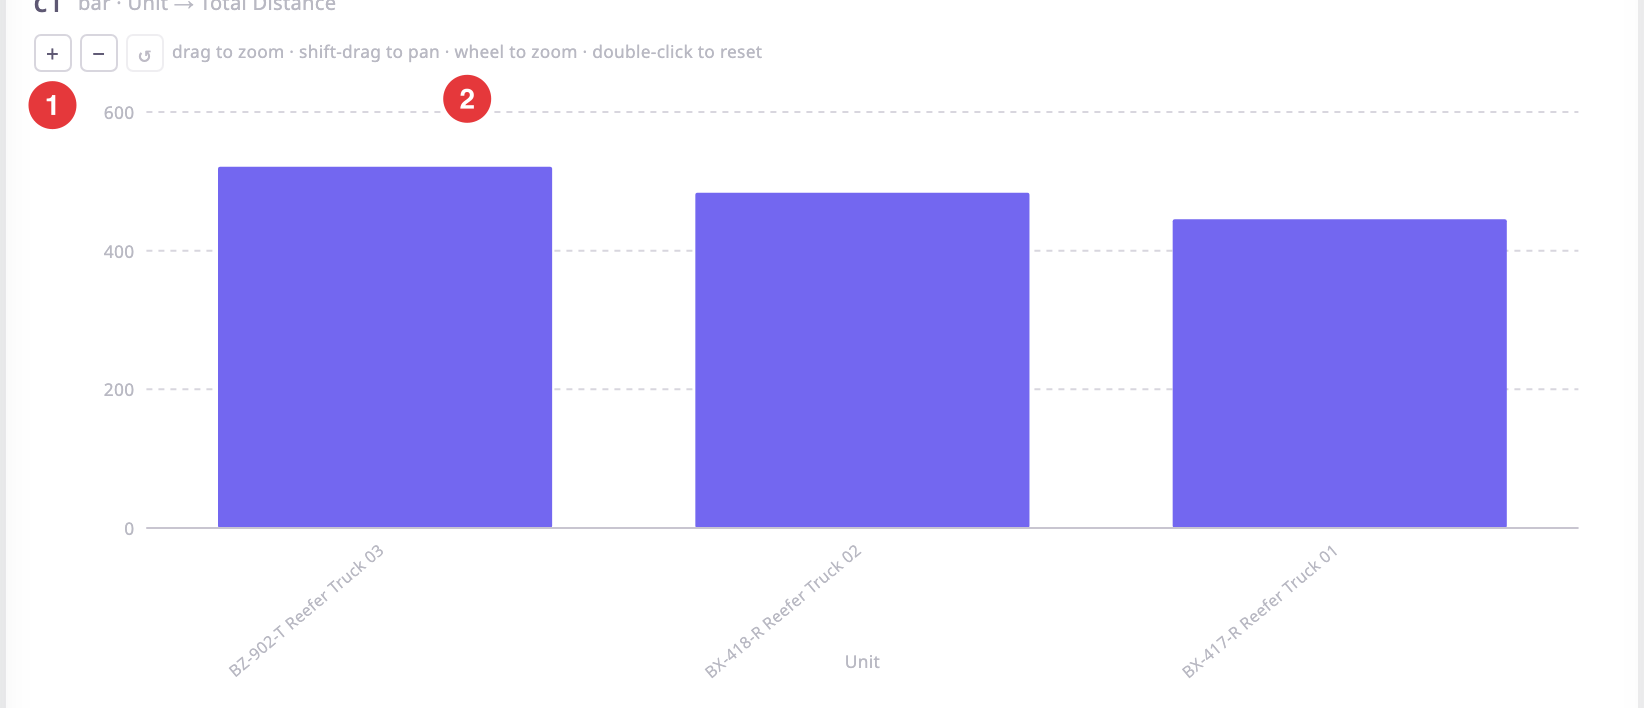
- The plus and minus buttons (1) zoom in and out; the third button resets the zoom.
- On the chart, drag to zoom into a range, shift-drag to pan, use the mouse wheel to zoom, and double-click to reset (2).
- In the legend, select a series to hide or show it.
A pie or donut chart has no zoom. To set up a chart, see Report chart settings.
¶ Tables, groups and totals
Each table block shows its name and row count, then the table.
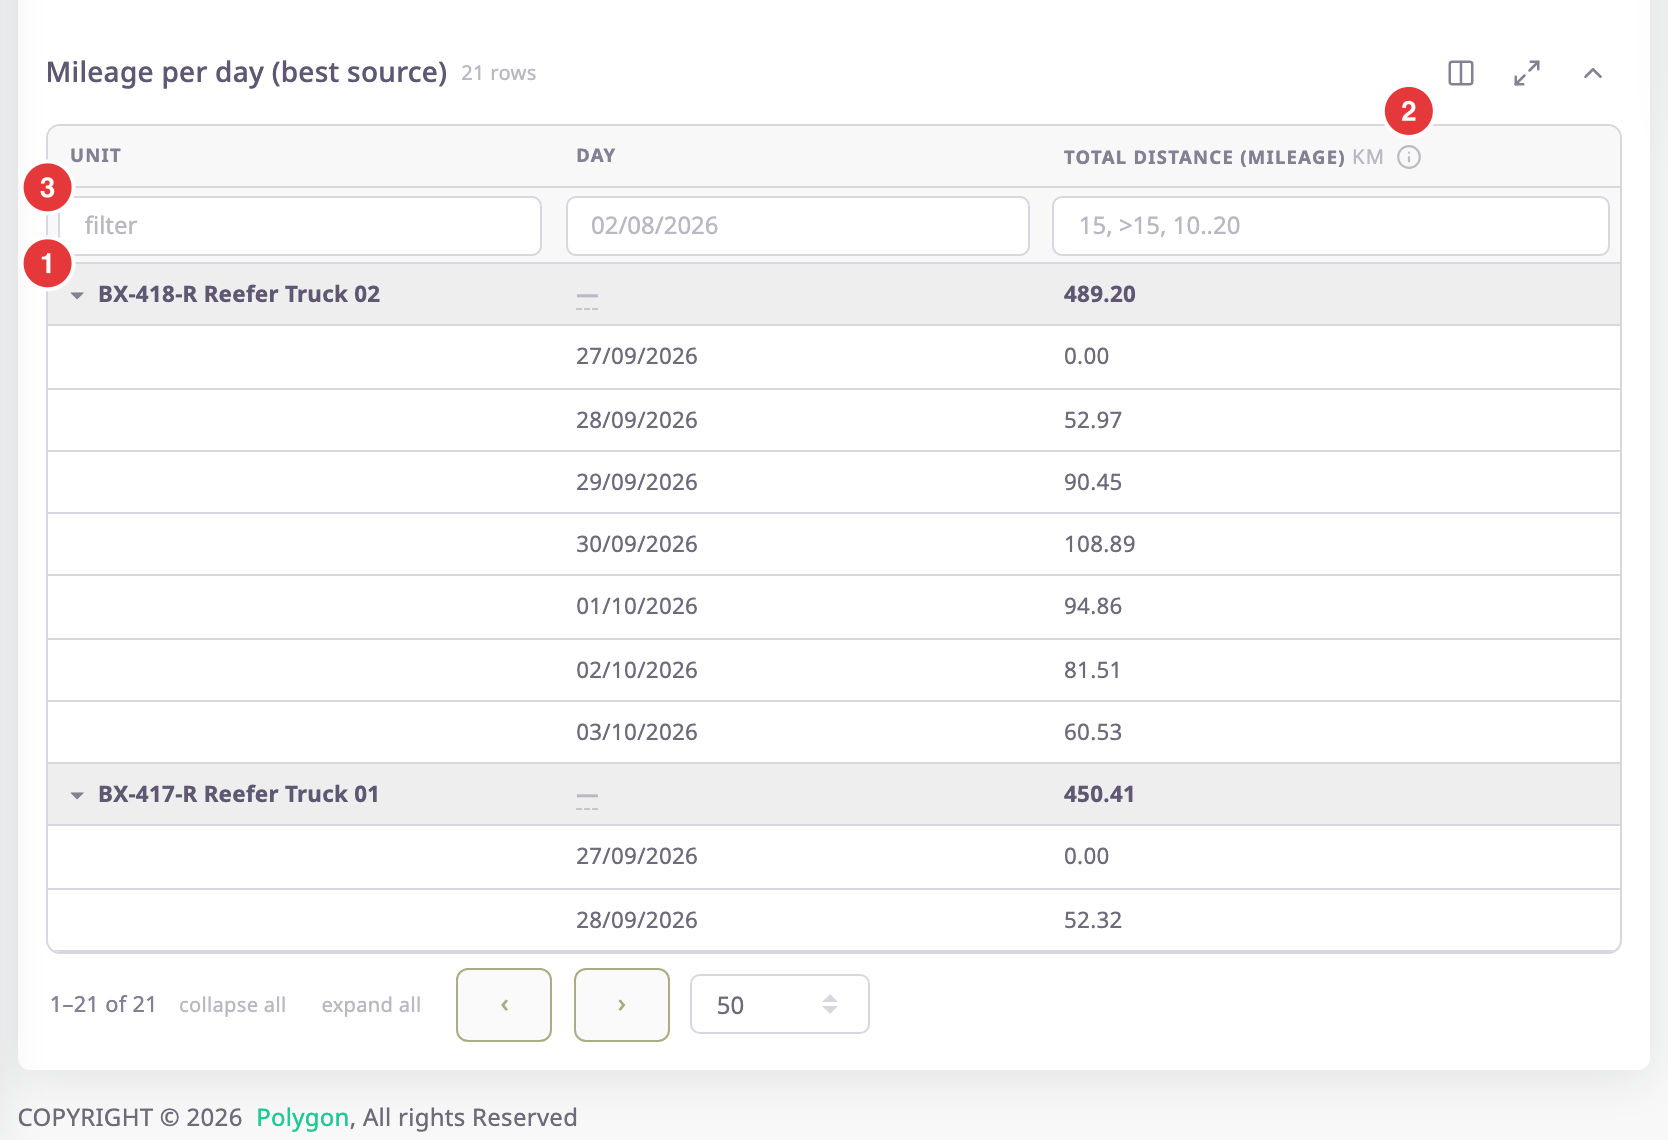
- Grouped rows (1): when the template groups a table, each group has a summary row with an arrow. Select the arrow to fold or unfold it. collapse all and expand all sit under the table.
- Info icon (2): the column reads different sources for different units. Select it to see which. See Where report data comes from.
- Filter row (3): type in the box under a column to narrow the rows. Text columns match names. Number columns take a value, a comparison or a range, such as "15, >15, 10..20". Duration columns take a time or a comparison, such as "1:30:00 or >45:00". Date columns take a date or a range.
- Sorting: select a column header to sort by it; select it again to reverse. While a sort is on, the table shows grouped rows flat.
- Total row: the row at the bottom totals the whole report, not only this page (7 in the first image). A small marker such as "max" or "avg" says how each column totals. A dash means the column has no meaningful total.
- A dash (—) in a cell means the unit has no sensor for that column. Hover over it for the reason. A row still in progress shows a "live" tag.
¶ Columns and paging
The three icons at the top right of each table:
| Icon | What it does |
|---|---|
| Columns | Opens the Columns menu. Clear a column to hide it; Show all brings every column back. Hidden columns are left out of exports too. |
| Arrows | Resize columns to fit. |
| Chevron | Collapse the table. Select it again to expand it. |
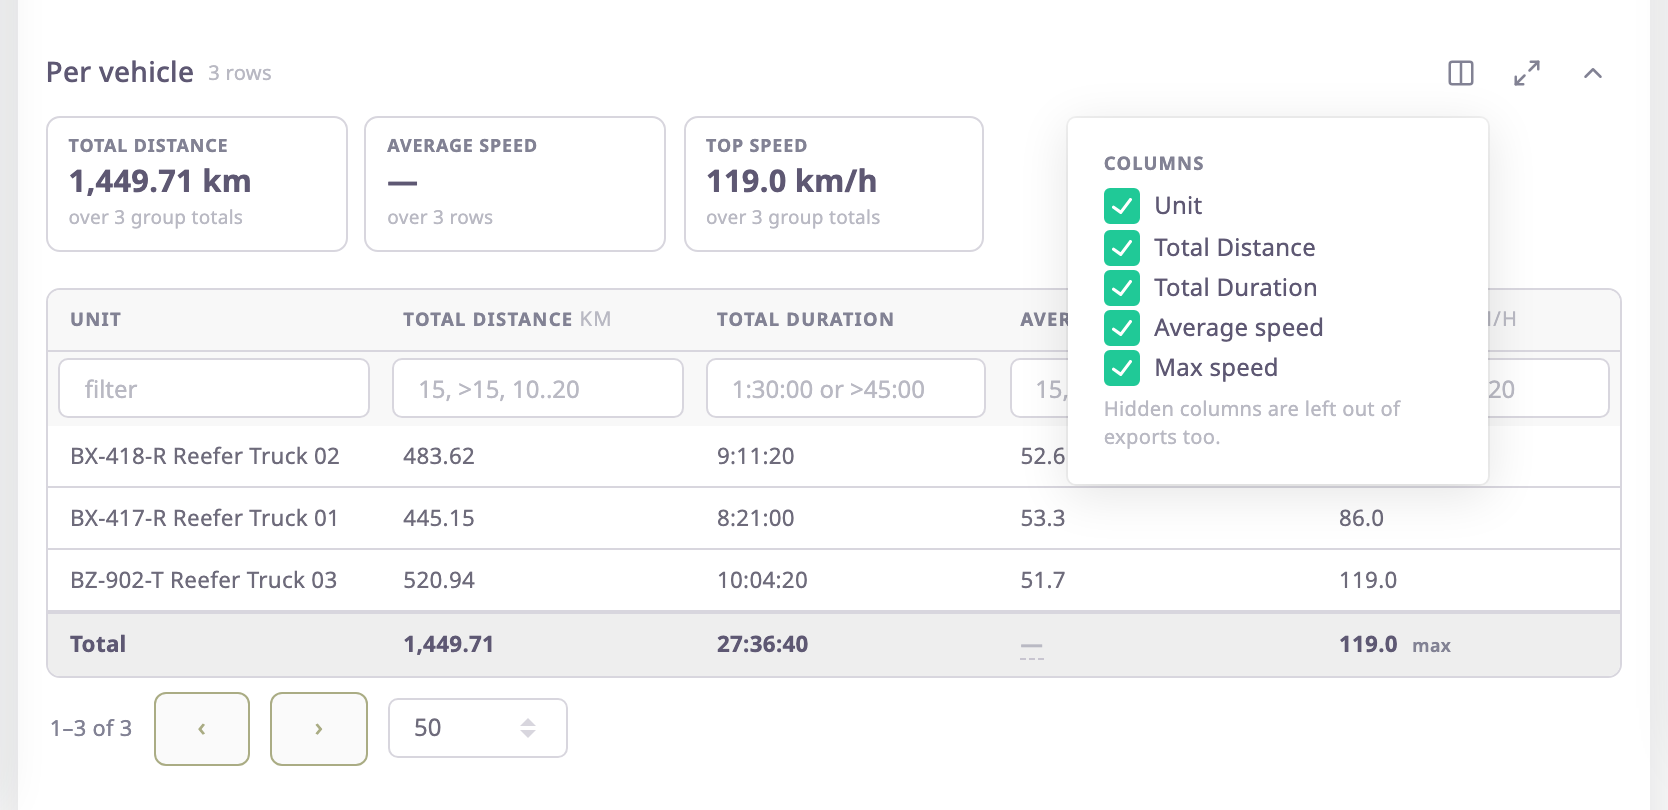
To set a column's width, drag the edge of its header. Double-click the edge to reset the table's widths. The widths you set also apply to the PDF.
Under each table, "1–21 of 21" shows which rows are on screen. Use the arrows to change page, and the list next to them to show 25, 50, 100, 250 or 500 rows per page. The default is 50.