A chart is part of a template. You set it up once in the template builder. The same settings draw the chart on screen, in the PDF, in the Excel export and in a dashboard widget.
To add one, open a template in the builder and select Add a chart under the tables. A list of ready-made charts opens.
¶ Ready-made charts
The Add a chart list offers charts that are already set up: the table, the axes and the values. Picking one adds a working chart to the template. You can still change all of its settings afterwards.
The list is in three parts:
- Suggested for the tables in this report: ready-made charts for the data sources your template already reads.
- Ready-made charts for every other source, grouped as Fuel, Movement, Events and driving and Drivers and routes. Each one names its source and the sensor it needs, for example "Fuel usage · Needs Fuel level".
- Blank chart: an empty chart where you pick the table, the axes and the values yourself.
Enter text in Search charts to filter the list by name, description or source. Cancel closes the list without adding anything.
When the chart reads a source that is not in your template yet, the builder adds a table for it. The builder sets Hide this table — its rows only feed charts on that table, so it does not print. When the template already has a table for that source, the chart uses it. If you later remove the chart, the builder also removes the hidden table it added, unless another chart still uses it.
In the list of data sources on the left, a source with ready-made charts shows how many, for example "3 ready charts".
| Group | Ready-made charts |
|---|---|
| Fuel | Fuel level, Fuel consumed per day, Fuel consumed by unit, Consumption: moving, idling, parked, Refilled per day, Drained per day, Refills by unit |
| Movement | Distance per day, Distance by unit, Trips per day, Top speed by unit, Odometer mileage per day, Engine hours per day, Engine hours by unit, Parking time per day, Parking time by unit |
| Events and driving | Events per day, Driving events per day, Driving events by type, Driving events by driver, SOS alarms per day, Power disconnects per day |
| Drivers and routes | Driving time by driver, Rides by status, Late rides by route, Missed checkpoints by route |
A ready-made chart is offered only for sources your installation records and your role may use.
¶ Fuel level from every message
Fuel level draws the tank level the way the Messages module does: every reading, thinned only to what the chart can show. A refill shows as a step, not a slope. Refills and drains are marked on the line at the moment they happened.
The units need a fuel level sensor. The Fuel level system template and the two fuel charts of New Fuel Report use this chart.
In the builder, this chart has its own settings in place of table, x and y.
| Field | What it does | Allowed values / example | Notes |
|---|---|---|---|
| Axes | Which x axes the reader can switch between. | Time, Mileage, or both. | At least one. |
| Opens on | The axis the chart shows first. | Time or Mileage. | One of the chosen axes. |
| Distance from | Where mileage comes from. | Odometer, else GPS, Odometer, GPS. | Odometer, else GPS by default: the odometer when the unit reports one, otherwise distance from GPS positions. |
| Show the smoothed line by default | Also draws the smoothed level the refill and drain detection uses, as a dashed line. | On or off. | Off by default. The reader can switch it in the report. |
The refill and drain markers are ordinary extra lines (see below) with the Event icons mark and on the line set. You can remove them or add others.
¶ In the report
Above the chart, Time and Mileage switch the x axis, and Smoothed shows or hides the smoothed line. Switching the axis resets the zoom.
The line next to the title says how the chart was drawn, for example "every message · 616 of 23181 points drawn · distance from odometer". When a unit's odometer reported for only part of the range, it says "odometer and GPS".
With several units, the chart draws one line per unit in its own colour; select a unit in the legend to hide or show its line. On the Mileage axis each unit starts at zero. The markers are placed at the distance the unit had covered at the moment of the refill or drain, so they sit on the line.
Limits, which your installation can change:
- Up to 20 units on one fuel level chart. With more, the chart shows "Too many units for the fuel chart".
- Up to 93 days. A longer range, or a range with more messages than the installation allows, shows "Fuel chart range is too large".
The rest of the report still runs when the chart refuses.
¶ Chart types
| Type | Use it for |
|---|---|
| Bar | Comparing units, drivers or days, such as distance by unit. |
| Line | A trend over time, such as distance per day. A new blank chart starts as a line. |
| Area | A trend where the size of the total matters. |
| Scatter | Single readings against each other or against time. |
| Pie, Donut | A split that adds up to a whole. These have no axes and no zoom. |
¶ Axes and values
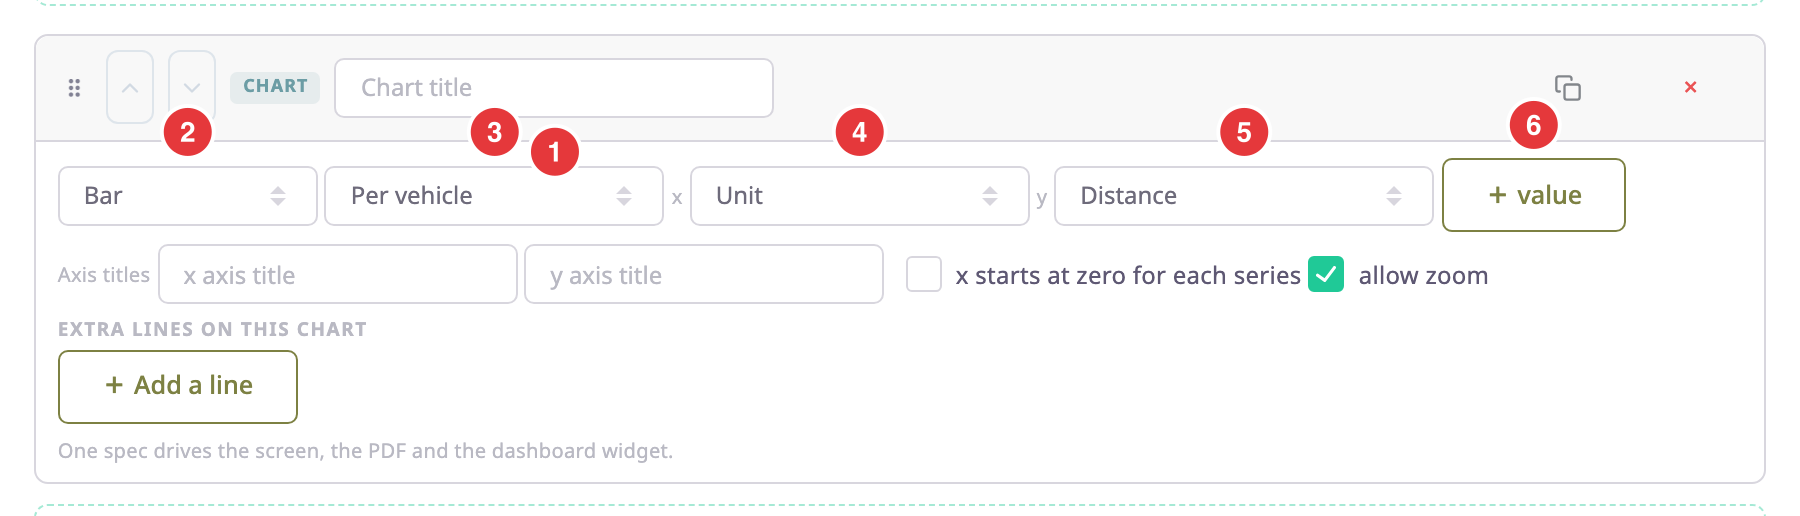
| Field | What it does | Allowed values / example | Notes |
|---|---|---|---|
| Chart title (1) | Names the chart on screen, in the PDF and in widgets. | Free text. Example: Distance by vehicle | Optional. |
| Chart type (2) | Sets how the chart draws the data. | Bar, Line, Area, Scatter, Pie, Donut | — |
| Table (3) | Picks the table whose rows the chart plots. | Any table in the template. | A table marked Hide this table — its rows only feed charts can feed a chart without printing. |
| x (4) | The value along the bottom, or the slices of a pie. | Any column of the table, and its grouping, such as Unit or Day. | — |
| y (5) | The value plotted. | Any column of the table. Example: Distance | value (6) adds another y value; × removes the last one. |
| Axis titles | Labels the x and y axes. | Free text in x axis title and y axis title. | Optional. |
| x starts at zero for each series | Draws each series from the same starting point. | On or off. | Off by default. |
| allow zoom | Lets readers zoom and pan the chart. | On or off. | On by default. No effect on a pie or donut. |
¶ Extra lines (series)
Add a line under Extra lines on this chart draws another series on the same chart, from this table or another one. Use it, for example, to mark refills on a fuel level line.
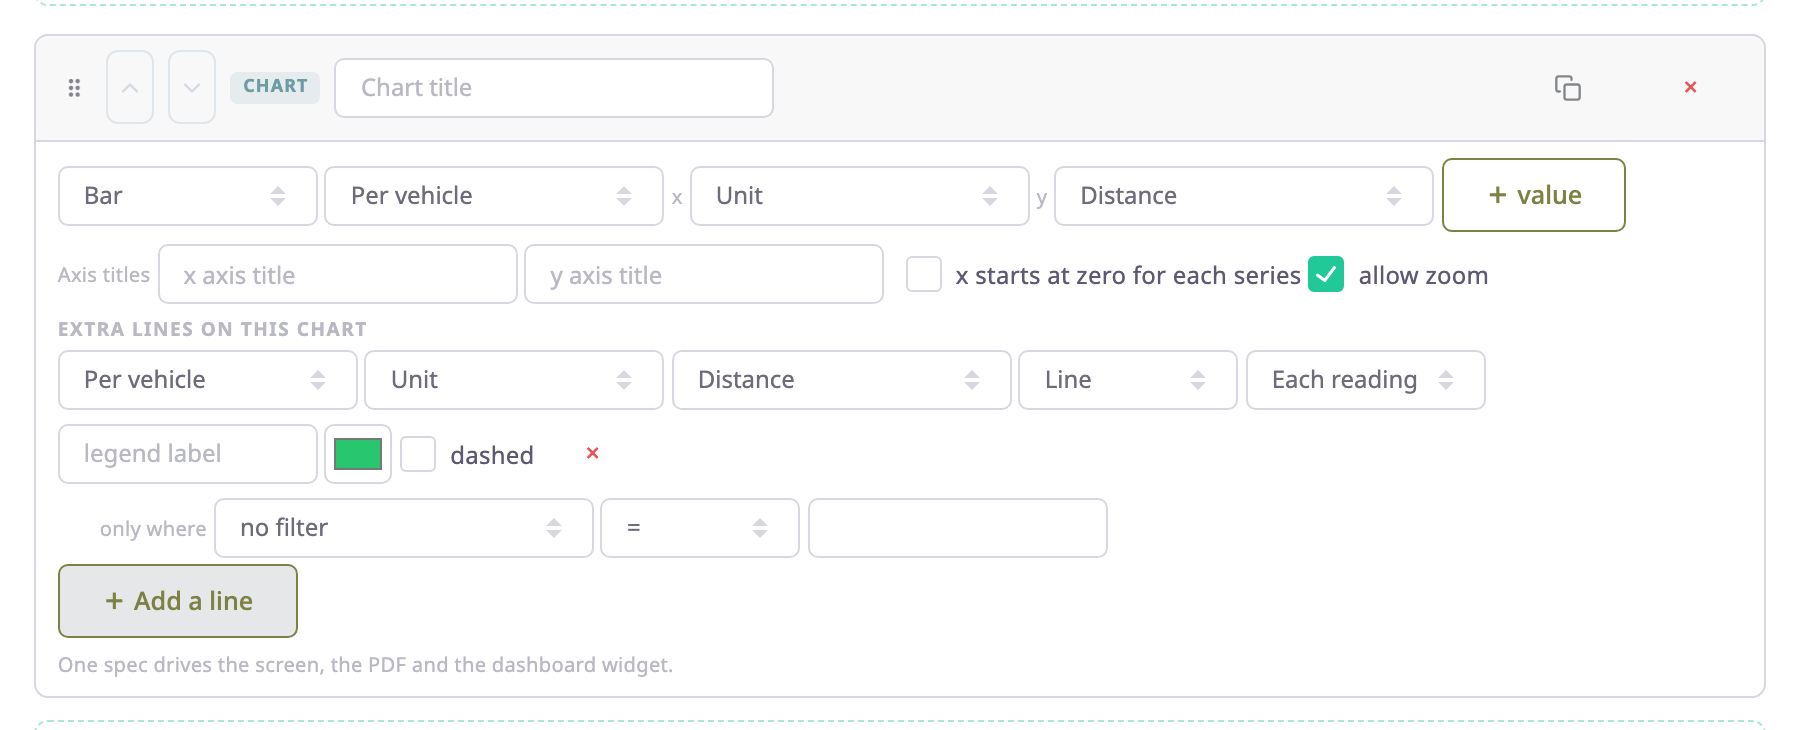
| Field | What it does |
|---|---|
| Table, x, y | Pick where the line's data comes from. |
| Mark | Line, Area, Points, Steps, Event icons, Interval band or Bar. |
| Icon and on the line | For Event icons: the icon, and whether to draw it at its value on the axis. Icons: Event, Refuelling, Draining, Parking, Stop, Movement, Engine hours. |
| Value | Each reading, Average, Total, Lowest or Highest of the y values. |
| legend label | The name in the legend. |
| Colour and dashed | How the line looks. |
| only where | Plots only the rows where a column matches a value. no filter plots every row. |
Select × at the end of the row to remove the line.
¶ Where the chart appears
- On screen, above the tables of the report, with zoom controls. See Report results.
- In the PDF export, drawn on the page of the table it reads. A chart that reads only hidden tables, such as Fuel level, is headed with its own title.
- In the Excel export, as a picture on the charts sheet.
- In a dashboard widget that shows the template as a chart.
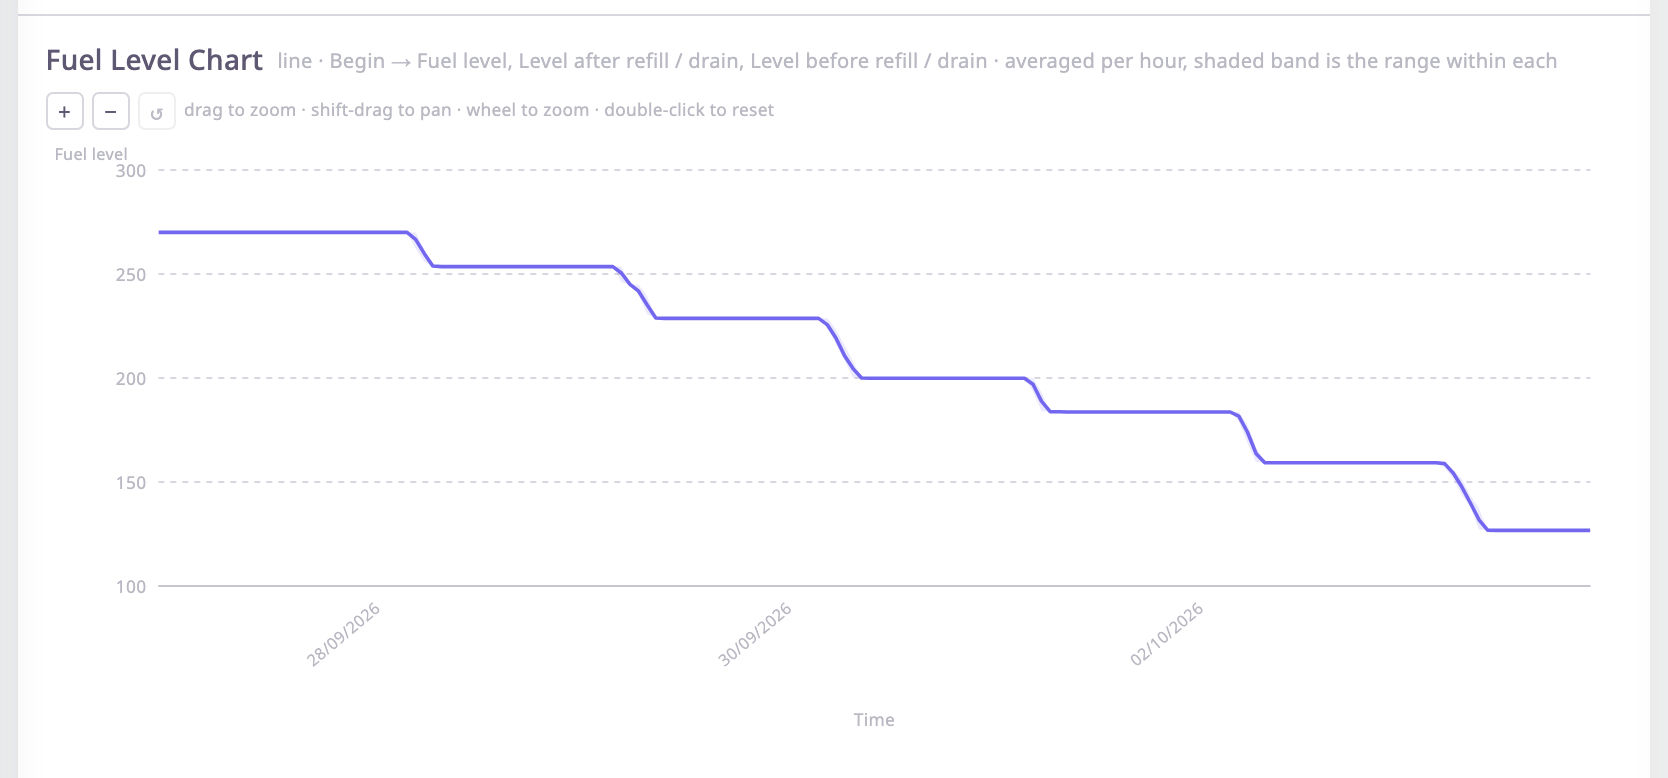
A chart with many points shows the average per time bucket, and a shaded band shows the range within each bucket. Fuel level is the exception: it is thinned the way the Messages module thins it, so refills keep their steps. By default a chart draws at most 20 series; it says how many more it did not show.