Polygon comes with 35 system templates. This page groups them by what they report on, so you can pick one without opening each. To use one, find it under System templates in Reports > Create Report and select Generate. To change one, save a copy first.
¶ How to read this page
- Tables and charts lists what the report contains. "Per unit" or "per day" means one row per unit or day; otherwise there is one row per record.
- Unit needs says which sensor a unit's device must have to fill the report. A unit without it still appears, with dashes. See Where report data comes from.
- The grouping on this page is for reading only. The library itself groups templates by owner and filters them by Tracking data, Fleet records and Combined.
- You see only the templates whose data your role may read. A dealer account sees all 35; a consumer account does not see the three that need device and SIM card permissions (marked below).
¶ Trips, parking and mileage
| Template | What it shows | Tables and charts | Unit needs |
|---|---|---|---|
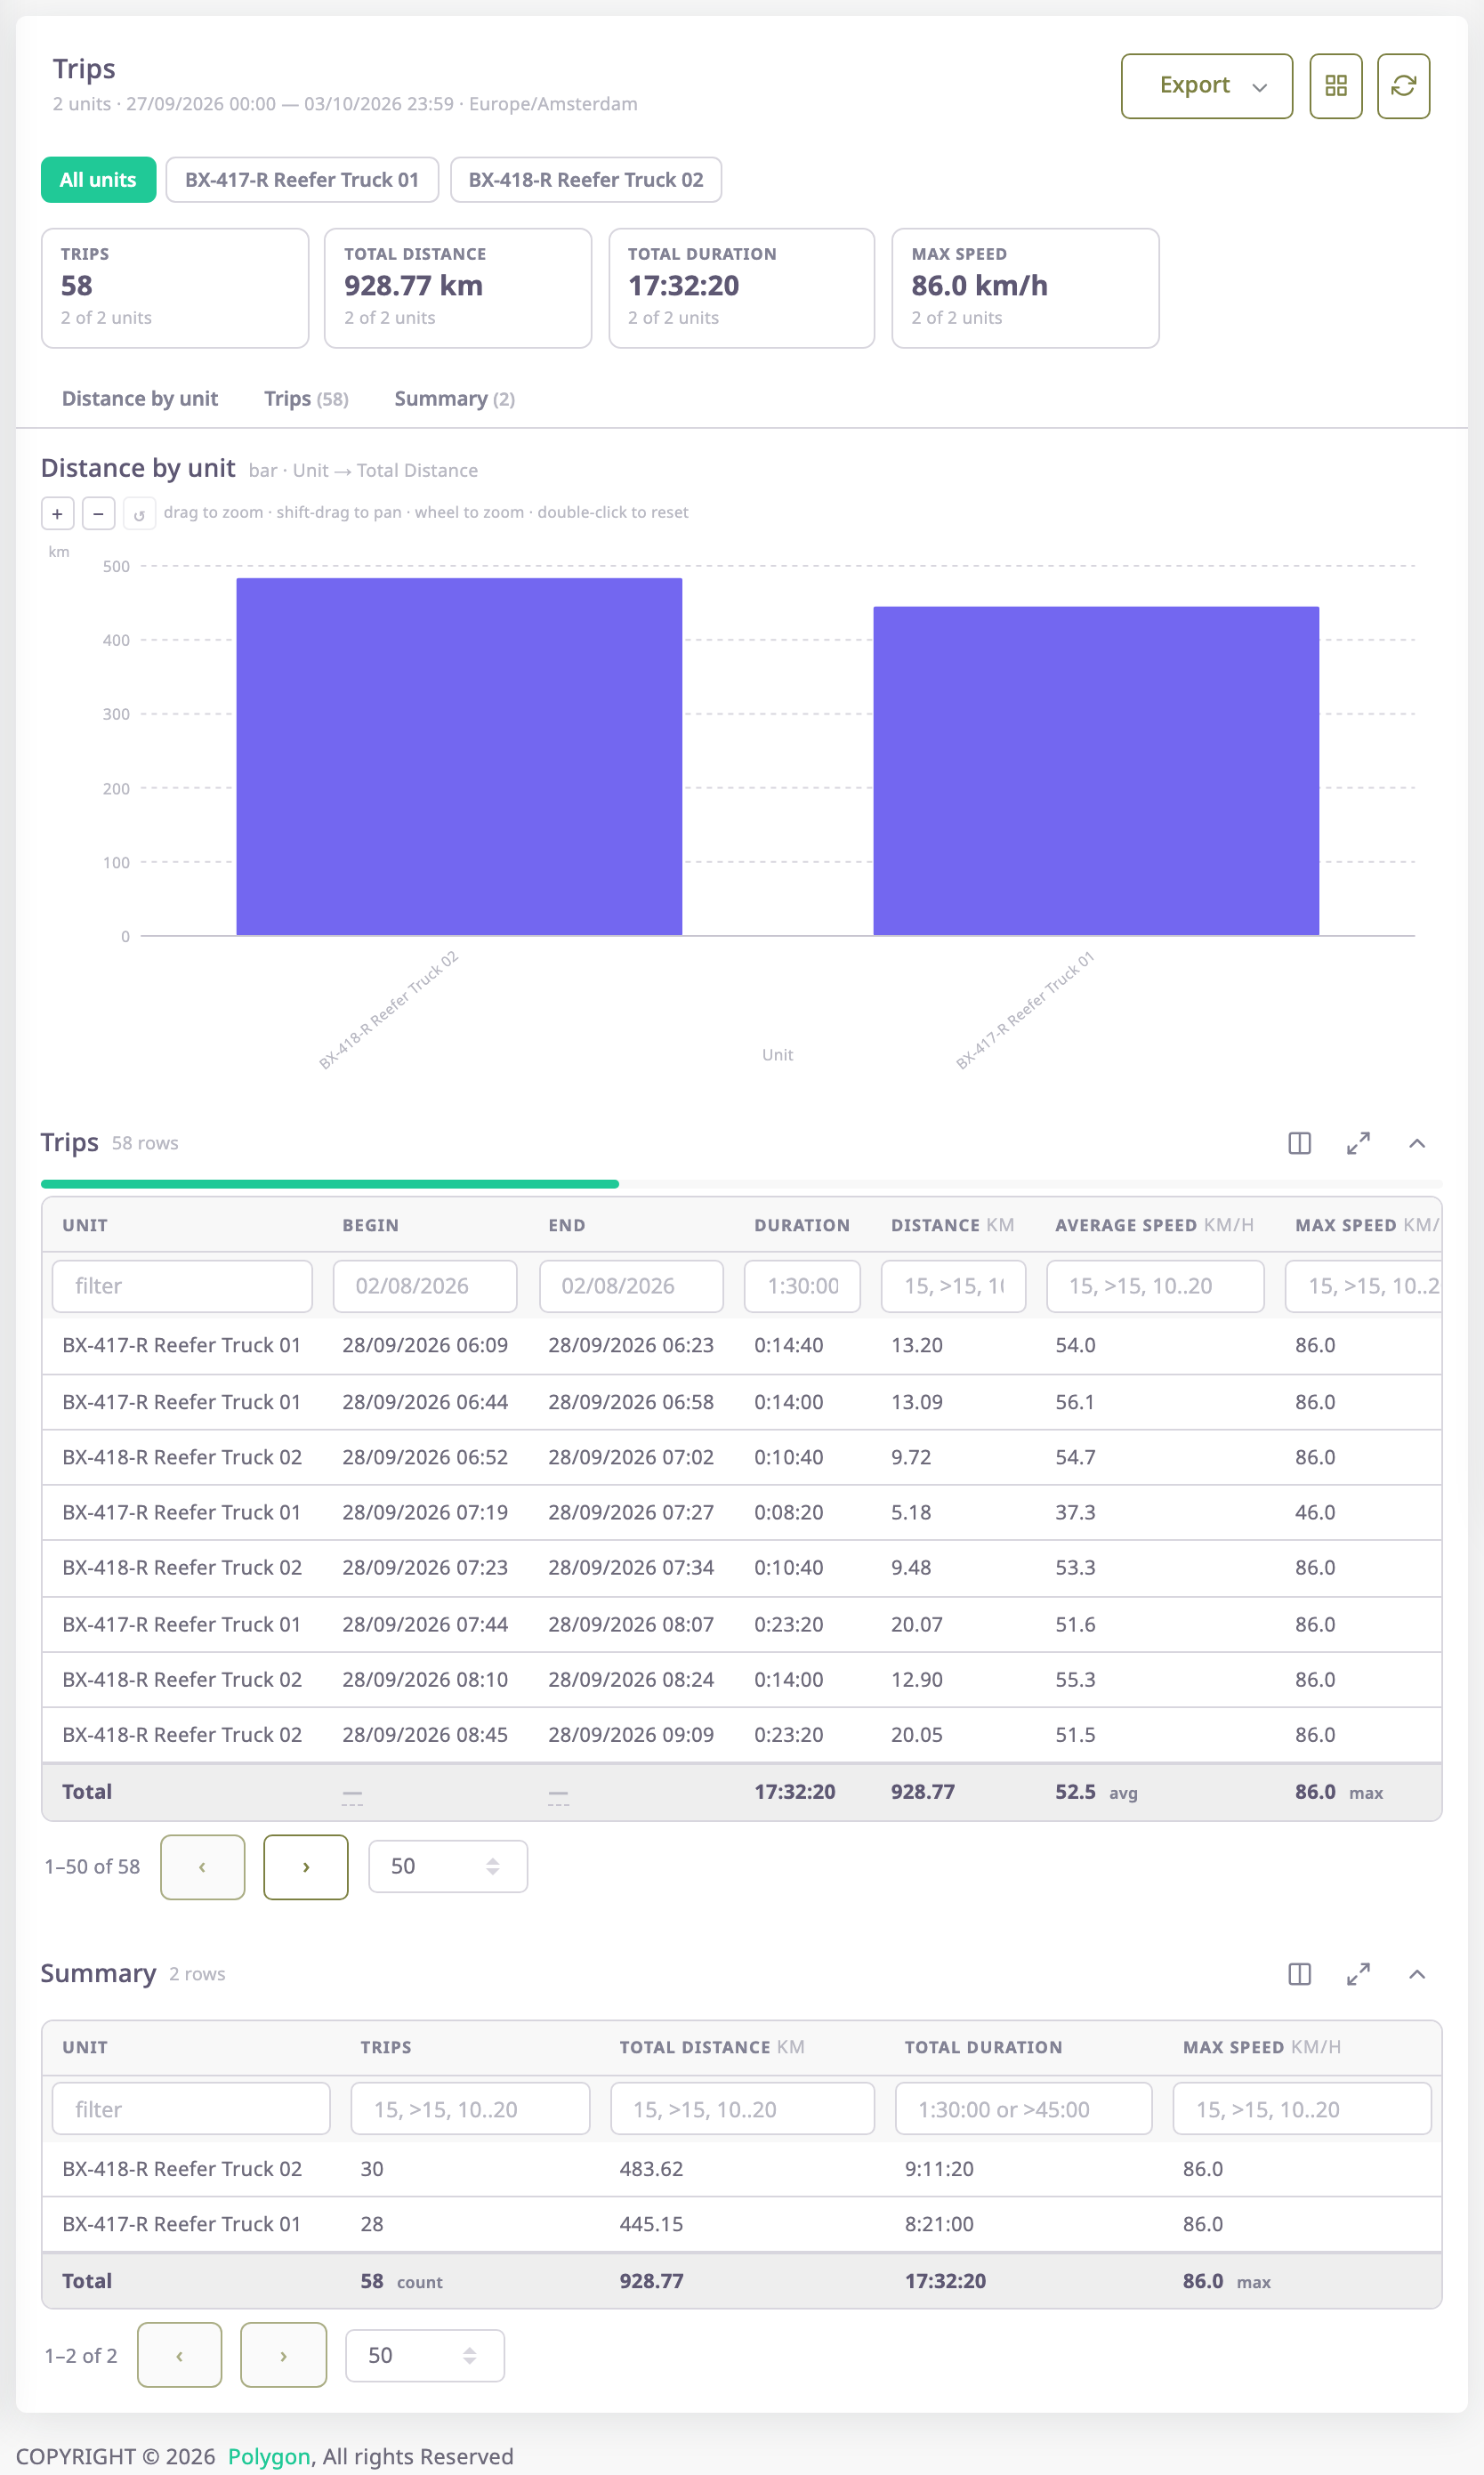
| Trips | Every trip with distance, duration, speed and the fuel level at start and end. | Trips; a summary per unit; a distance-by-unit chart | No sensor |
| Parkings | Every parking with its duration, position and how long the ignition was on. | Parkings | No sensor |
| Chronology | One timeline of trips, parkings and stops. | Timeline | No sensor |
| Daily summary | Distance, driving time and top speed per unit and day. | Per unit and day; a distance-by-day chart | No sensor |
| Mileage | Distance per unit and day from each unit's best source: the odometer where there is one. | Per unit and day | Odometer or relative odometer for the best figures |
| Distance by unit | Total distance per unit for the period. Suits a KPI, chart or short table on a dashboard. | Per unit; bar chart | No sensor |
| Distance per day | Fleet distance day by day. | Per day; chart | No sensor |
| Top speed by unit | The fastest each unit went, and how far it travelled. | Per unit; bar chart | No sensor |
¶ Engine hours and idling
| Template | What it shows | Tables and charts | Unit needs |
|---|---|---|---|
| Engine hours | Each engine-hours record, with the idling inside it and the time left for motion. | Engine hours; idling; a summary per unit | Engine hours, engine or ignition sensor; idle sensor for idling |
| Engine hours per day | How long the engines ran, day by day. | Per day; chart | Engine or ignition sensor |
| Idling by unit | Time spent idling and the fuel it burned, per unit. | Per unit; bar chart | Fuel level sensor |
¶ Fuel
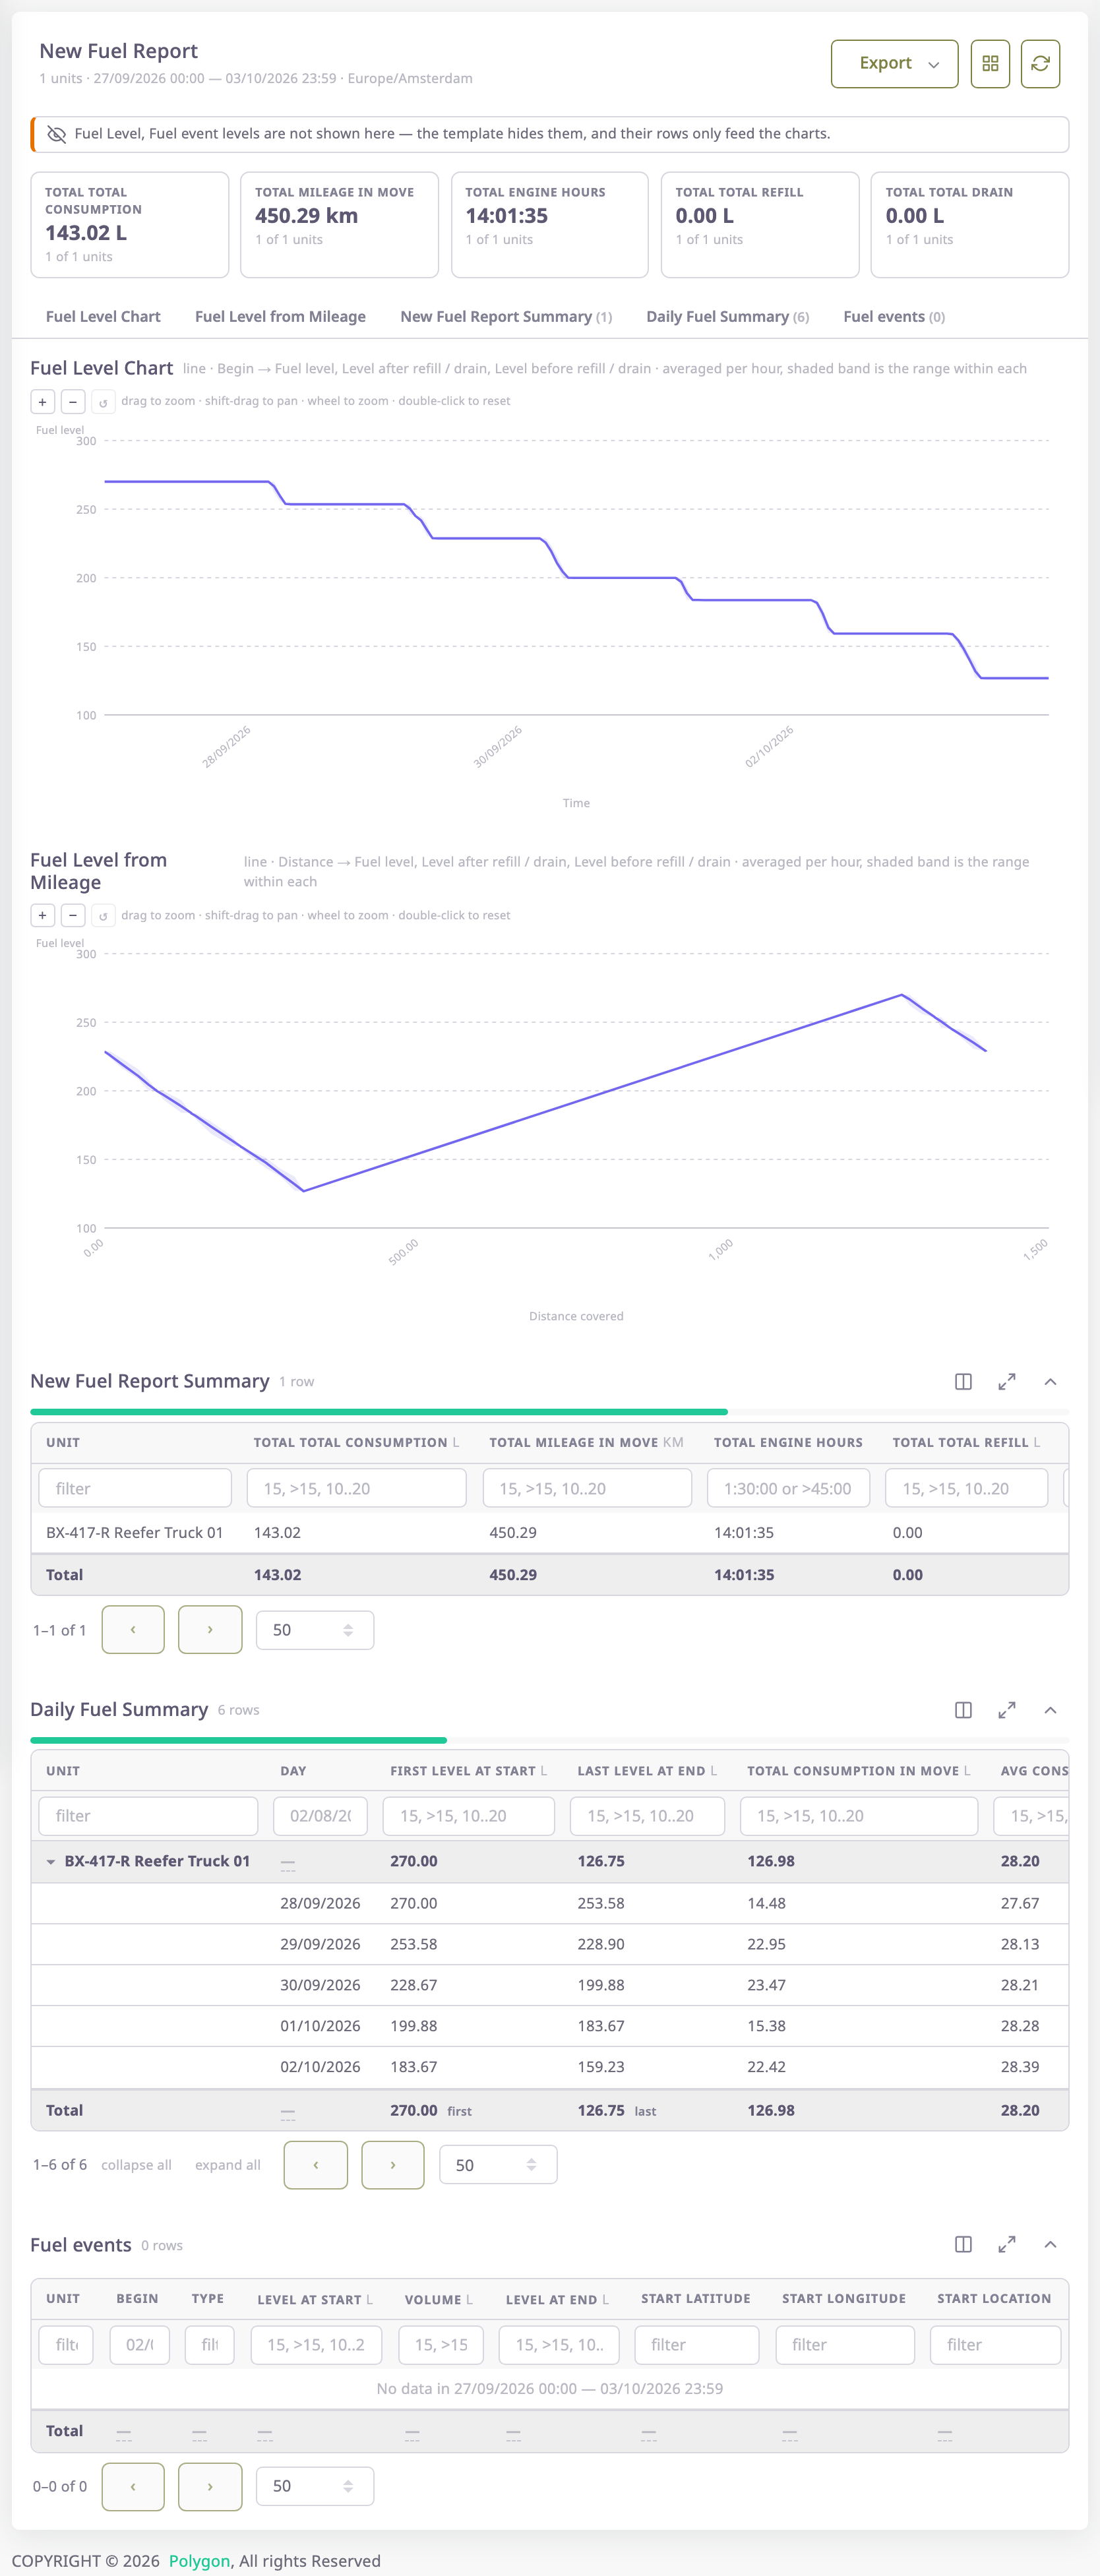
All fuel templates need a fuel level sensor. The fuel level charts draw every reading, as the Messages module does, so a refill shows as a step. See Fuel level from every message.
| Template | What it shows | Tables and charts |
|---|---|---|
| Fuel level | The tank level from every message, against time or distance, with refills and drains marked on the line. | One fuel level chart with a Time / Mileage switch; no printed tables |
| New Fuel Report | Fuel used per day, split into driving, idling and parking, with refills, drains and the tank level over time and distance. | A summary per unit; per unit and day; fuel events; two fuel level charts drawn from every message (one opens on time, one on mileage) |
| Fuel events | Detected drains and refills with their volumes. | Fuel events |
| Fuel consumed by unit | Fuel used and the distance driven, per unit. | Per unit; bar chart |
| Fuel consumed per day | Total fuel used, day by day. | Per day; chart |
| Refills and drains by unit | Fuel added and lost per unit, with the number of each. | Per unit; bar chart |
¶ Driver and driving behaviour
| Template | What it shows | Tables and charts | Unit needs |
|---|---|---|---|
| Eco driving | Harsh acceleration, braking, cornering and speeding events. | Events; a summary per driver | Driver behaviour sensor |
| Driving events by driver | The same events, counted per driver. | Per driver; bar chart | Driver behaviour sensor |
| Driver assignments | Which driver drove which unit, and when. | Assignments | No sensor; units need drivers assigned |
To assign drivers to units, see Operators and drivers.
¶ Routes and geofences
These templates need no sensor. Route templates need routes with schedules; see the Routes & places section of the Generate report screen.
| Template | What it shows | Tables and charts |
|---|---|---|
| Time on site | How often units enter each geofence and how long they stay. | Per geofence; bar chart |
| Ride log | Every ride against its schedule, with the route, the outcome and how late it ran. | Rides |
| Route adherence | Rides per unit and day, how many ran late and by how much. | Per unit and day; average lateness by day chart |
| Checkpoint performance | Every checkpoint ranked by lateness, misses and waiting time. | Per checkpoint; average lateness chart |
| Schedule plan vs actual | Each schedule's recorded arrivals next to its plan. | Per schedule; the plan |
¶ Fleet records and maintenance
These templates read what your account holds now. They need no sensor, and the date range does not change their rows unless they also read tracking data.
| Template | What it shows | Tables and charts |
|---|---|---|
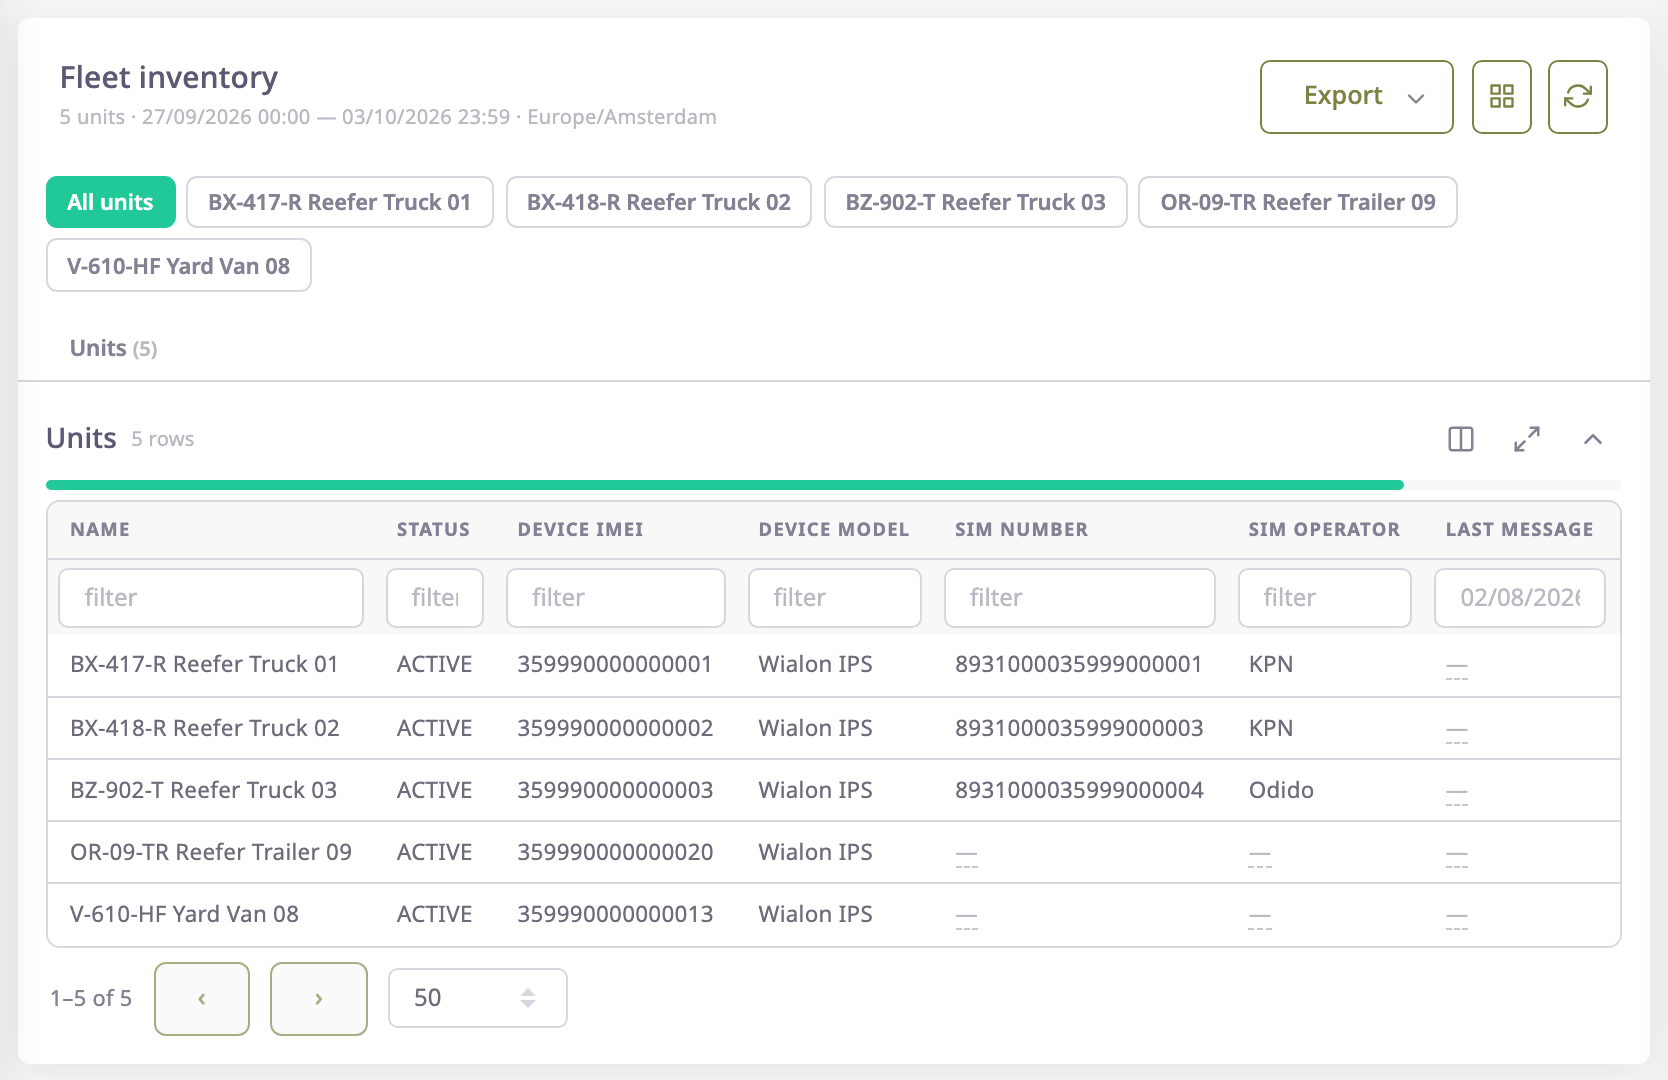
| Fleet inventory | Every unit with the device and SIM card fitted, and when it last reported. | Units |
| Fleet utilisation | What each unit did in the period, next to its device, SIM card and last contact. | Activity per unit; units; distance-by-unit chart |
| Accounts and fleet size | The accounts below yours, with how many units and devices each holds. | Accounts |
| Driver register | Every driver of the account, with code and contact details. | Drivers |
| Device contact | The devices, the longest silent first. Needs the devices permission; not shown to consumer accounts. | Devices |
| SIM expiry | SIM cards whose validity has run out or soon will. Needs the SIM cards permission; not shown to consumer accounts. | SIMs due for recharge |
| SIM recharge history | Every recharge: amount, SIM card and plan. Needs the SIM cards permission; not shown to consumer accounts. | Recharges |
| Maintenance due | Service reminders, soonest due first. | Service reminders |
| Maintenance history | Every service done, with the odometer and engine hours at the time. | Services |
| Maintenance against mileage | Distance and engine hours per unit in the period, next to the services done on it. | Per unit; services; distance-by-unit chart |
Maintenance reminders are described in Maintenance.