Reports do not read raw device messages when you run them. Polygon works out trips, parkings, fuel events and similar records from the messages as they arrive, and stores them. A report reads those stored records, so it runs in seconds even over weeks of data.
¶ Kinds of data source
Every template reads one or more data sources. The library and the builder sort them into these kinds:
| Kind | What it holds | Examples |
|---|---|---|
| Tracking data | Records worked out from what each unit's device reported, for a period. | Trips, parkings, fuel refills, engine hours, geofence visits |
| Fleet records | What your account holds now. These have no period: the date range does not change the rows. | Units, devices, SIM cards, drivers, maintenance |
| Calculated | Records already folded together, such as one row per unit and day. | Daily summary |
| AI Assistant | Fleet records about the AI Assistant: what each account used and who has AI. Shown to roles with Manage AI Assistant Settings. | AI usage, AI access & grants, AI credit top-ups, AI grant change history |
In the library, the Combined filter shows templates that read both tracking data and fleet records.
One table can also read several kinds of one family, such as Fuel drains and Fuel refills, as a single list. See Report template builder.
AI Assistant sources have no unit or driver. Two AI Assistant tables match by account. AI usage and AI credit top-ups can also be read by whole billing months, so a monthly figure equals what the AI credit meter counted.
¶ Sources need sensors
Much tracking data needs a sensor on the unit's device. Trips, parkings and stops need no sensor. Fuel sources need a fuel level sensor, and engine hours from a counter need an engine hours sensor. The builder shows what each source needs under its name, for example "Needs Fuel level" or "No sensors needed".
To add a sensor, see Sensors.
¶ Units that cannot answer a report
Each template card says how many of your units can answer it, for example "Available on 7 of 12 units". Select that line to see which units lack which sensor.
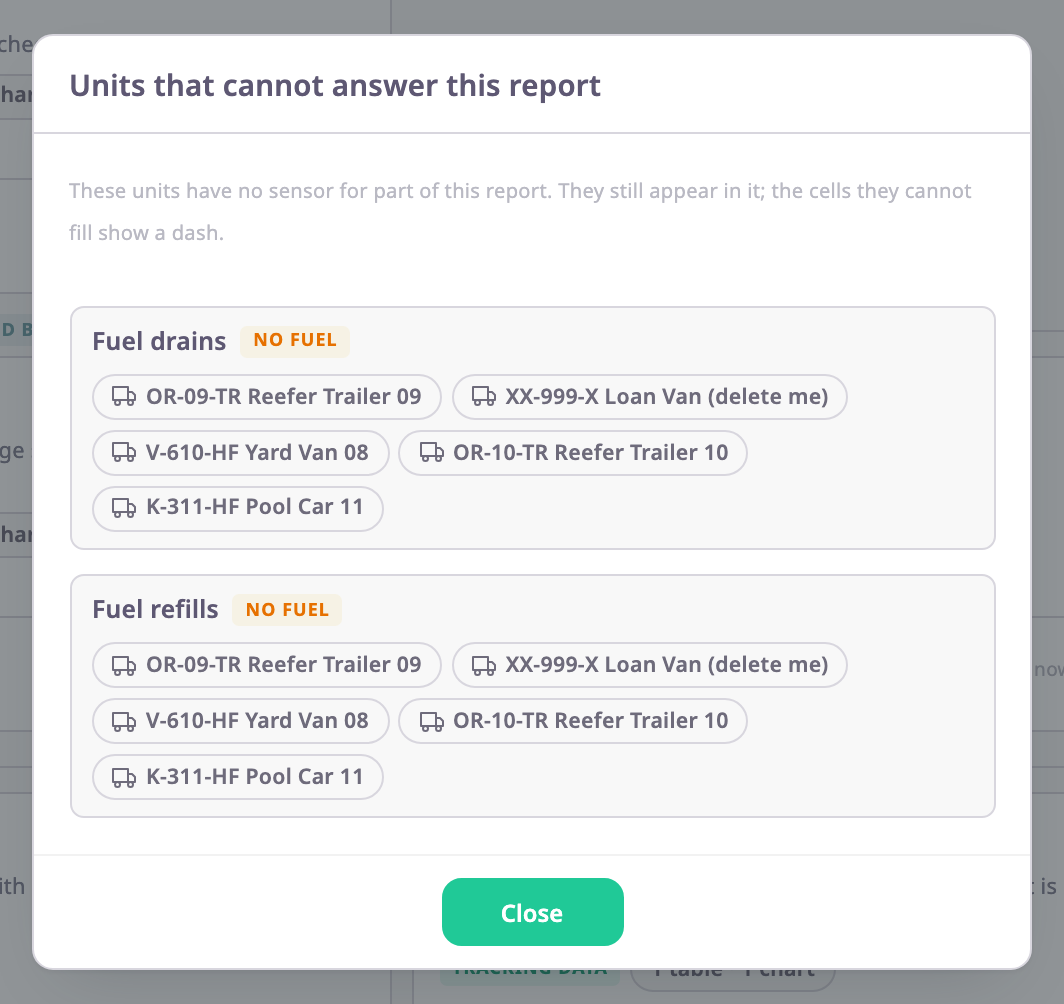
A unit that cannot answer still appears in the report. The cells it cannot fill show a dash (—). A dash means "no sensor, so no value"; a zero means "the sensor was there and measured nothing". The two are never mixed up.
On the Generate screen, a warning lists the selected units that lack a sensor. You can exclude them or continue. See Generate report screen.
¶ Best available and conditional columns
Some units measure the same thing in different ways. One truck has an odometer, another has only GPS. A best-available column, also called a conditional column, reads each unit from the first source in its list that the unit can answer. For example, distance comes from the odometer where there is one, and from GPS trips otherwise.
A column header with an info icon reads more than one source. Select the icon to see which source each unit came from.
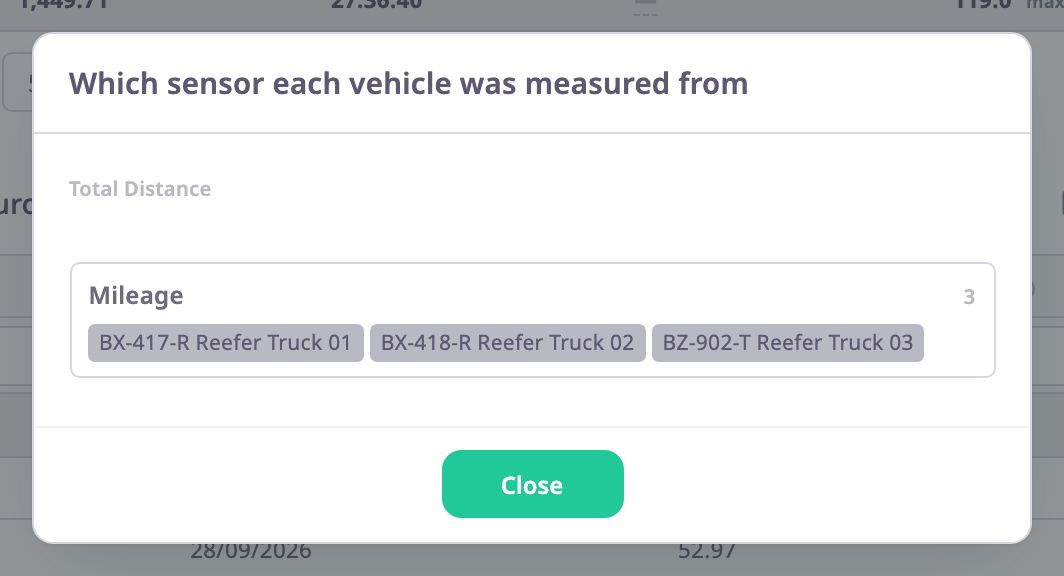
To build such a column, see Add calculated and best-available columns.
¶ Totals cover the whole report
Polygon works out the total row and the KPI cards over the whole report, not only the page on screen. A column with no meaningful total, such as an average of averages, shows a dash in the total row.
¶ Time zone, units and stored figures
- All times use the time zone in your account settings. The report and every file you export carry that time zone.
- Distances, speeds and volumes use the unit system in your account settings. Durations show as hours, minutes and seconds.
- When someone changes a sensor, a trip setting or which device sits in a unit, Polygon recalculates the stored records for the affected period. While that runs, or for a period that was never calculated, the Generate screen tells you. You can wait for fresh figures or run with the stored ones. See Generate report screen.
- A saved report keeps the template as it was when it ran. Changing the template later does not change the saved report.