Run a report when you need figures for a period, such as every trip your vans made last week. You pick a template, a period and the units, and the report appears on the same screen.
¶ Before you start
- You need the Read template action of Reports, and the data-source permission the template reads, such as Trips & parkings. The Owner role has them all.
- Know which template answers your question. See Report template catalogue.
¶ Choose a template
-
In the side menu, select Reports > Create Report.
The template library opens. -
On the template's card, select Generate, marked 2.
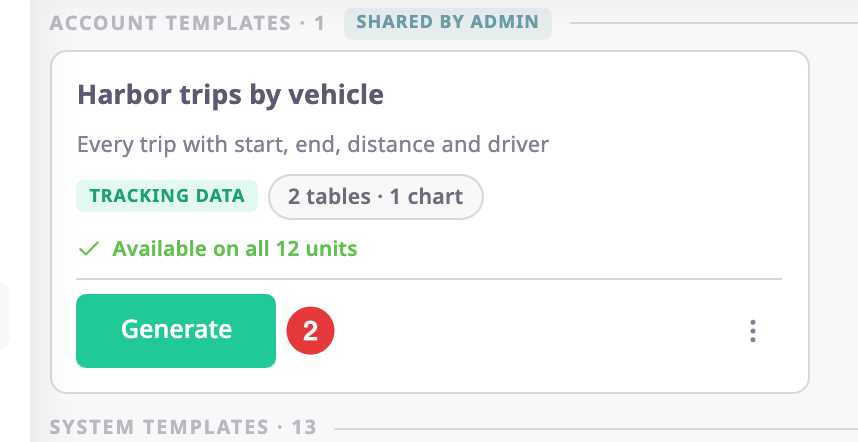
The Generate screen opens. The preview lists the tables and charts the report will have.
If the card says "Available on 7 of 12 units", some units lack a sensor the template needs. They still appear in the report, with dashes.
¶ Set the period
-
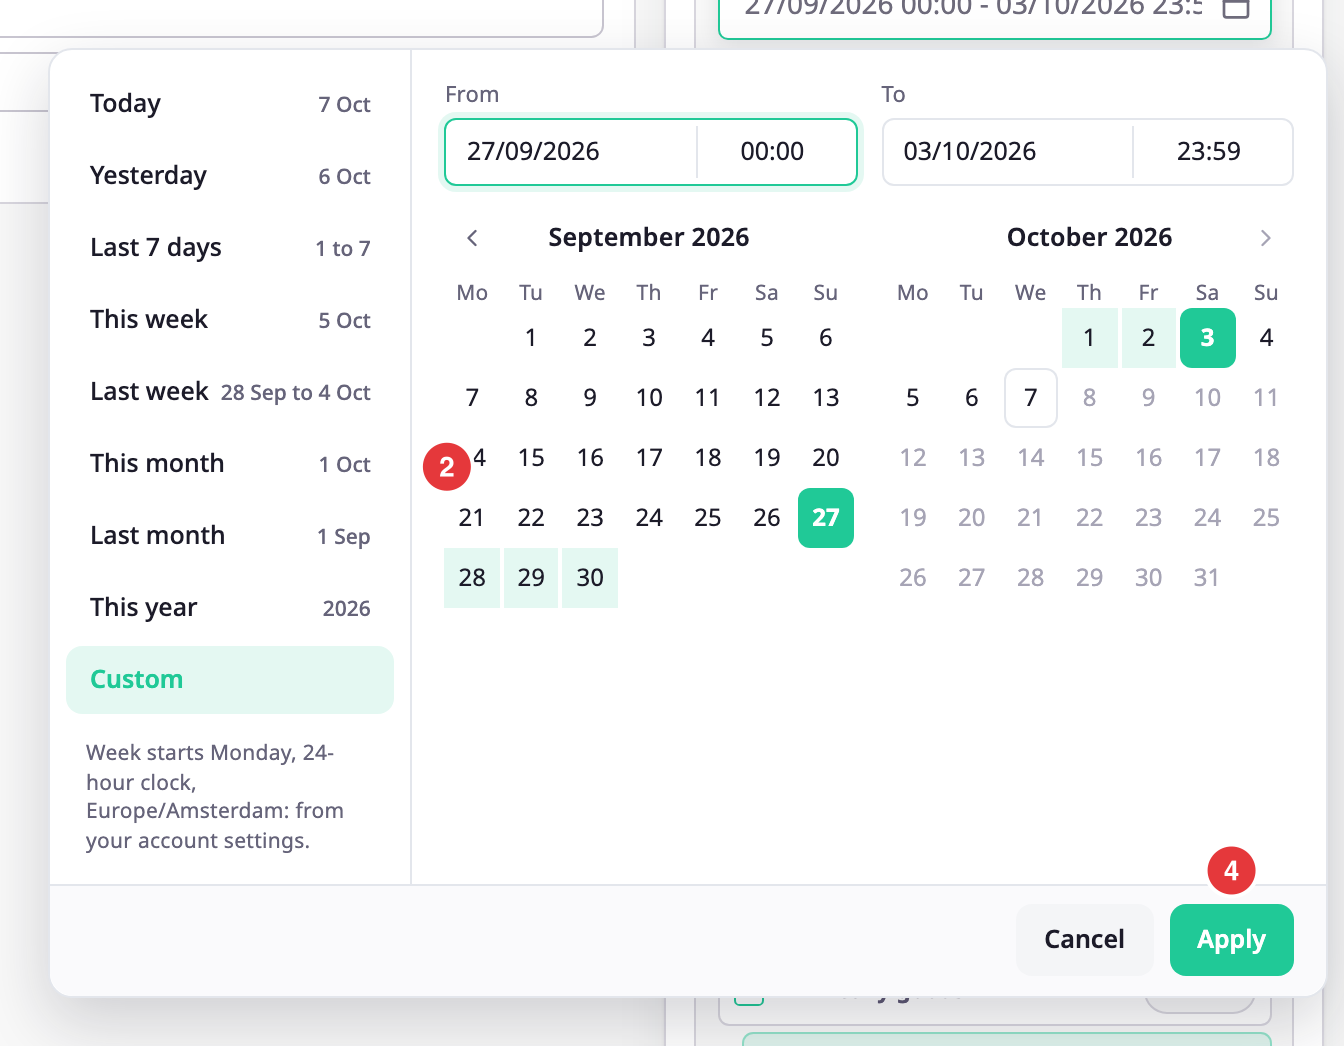
In Date range, select the field.
A calendar opens. -
Choose a preset on the left, marked 2, or select a start day and an end day.
-
Optional: Change the start and end times under the calendars.
-
Select Apply, marked 4.
The range appears in the field and in the section header.
Times are in your account's time zone.
¶ Choose units
-
In the Units section, type part of a group or unit name in the search box, marked 1, to filter the list.
-
Select the checkbox of each unit you want, or of a group, marked 2, to select all its units.
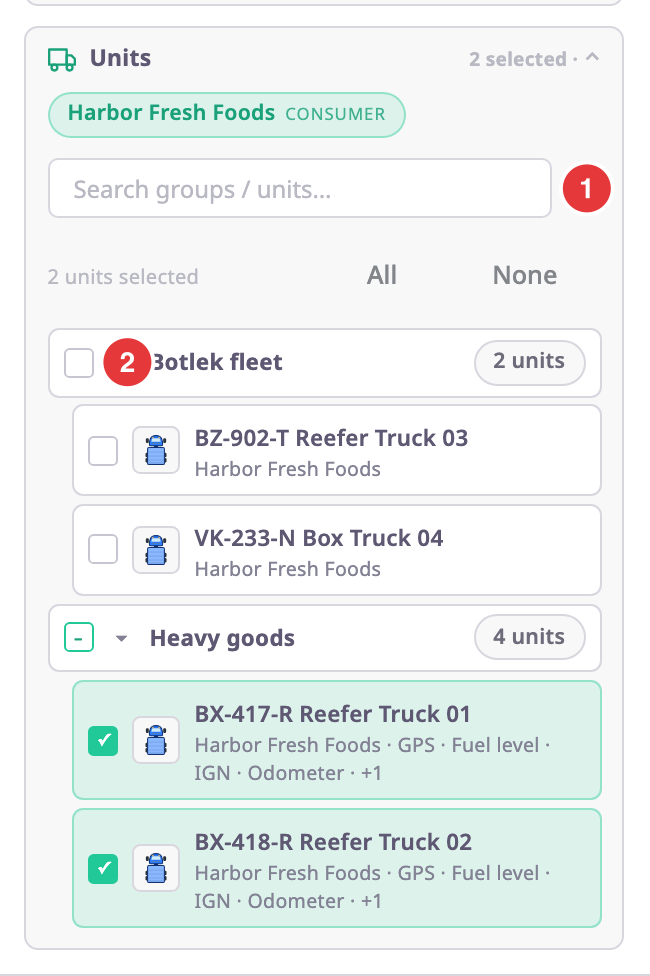
The header shows how many units you selected.
All selects every unit and None clears the list. If a warning says some units have no sensor for the template, select the exclude button to drop them, or Continue anyway.
¶ Generate and read the result
-
Check the estimate above the button, for example "≈ 42 rows".
-
Select Generate Report.
The report appears under the template header.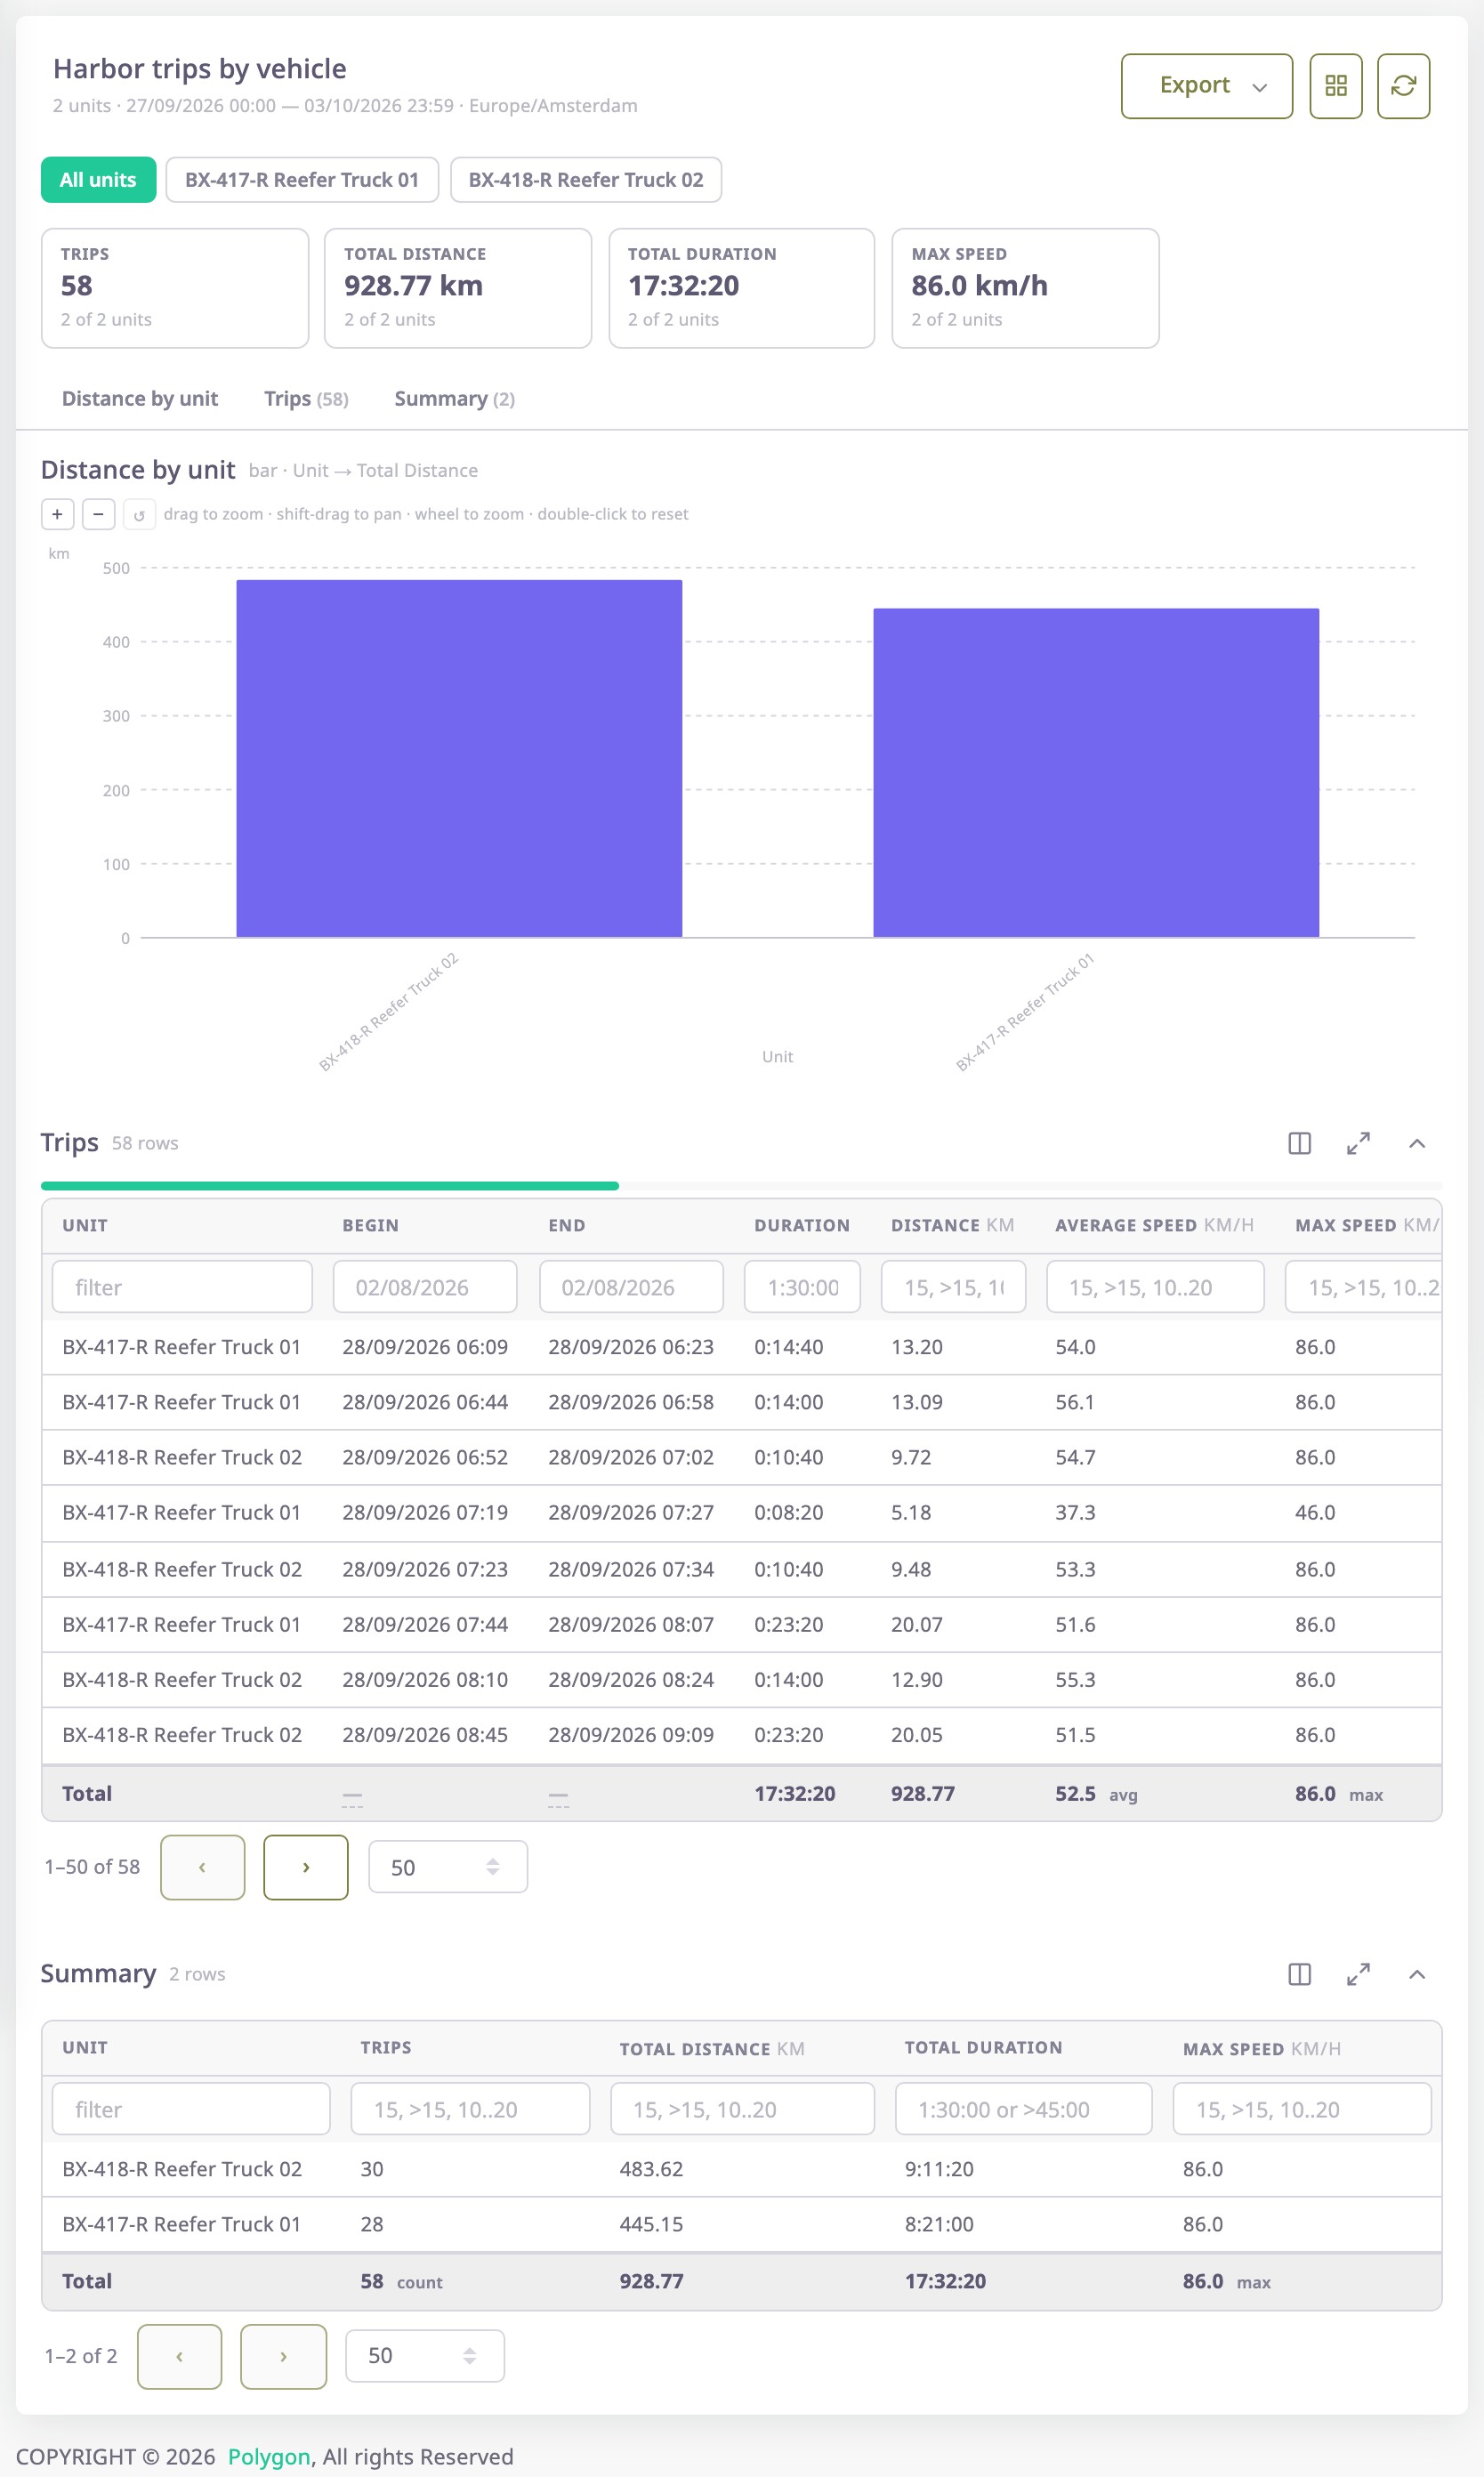
Use the unit pills to look at one unit, and the section links to jump to a table. To read the tables, totals and charts, see Report results.
¶ What happens next
The report is not saved. To keep a copy, export it; see Download a report as Excel, PDF or CSV. To get it regularly by email, see Send a report on a schedule.